This section explains how to manage dashboards using the Dashboard module.
Dashboards are composed of charts created and customized in the Chart Gallery section. These charts display indicators generated using information from risk management projects, compliance projects, and Workflow events. Once there are charts in the gallery, they can be used to create dashboards. Assembling a dashboard simply involves determining a display format for the charts selected (one or many columns showing one or many charts), as well as specifying which charts will be displayed in each section of the format selected.
Any authorized user can have their own dashboard or set of dashboards, in which charts can be included that were previously created in the Chart Gallery section. For details, see Chapter 9: Dashboard -> Chart Gallery.
Dashboards intended for audiences at the strategic level can be created, including: risks to the organization, risks by department, and main threats to the organization. Dashboards intended for the operational and technical audiences can also be created, such as risks by asset type, perimeter, or asset.
Once created, you can specify an audience for the dashboard, selecting people or groups of people who will be able to view it through the Dashboards section of the Home module or through the Dashboard module, if they have permission to it. Keep in mind that the audience will only be able to view the charts to which the author of the dashboard has permission. Also note that dashboards can only be edited by their authors.
A drill-down feature is also available to allow further details on a chart included in a dashboard to be viewed. Increasingly refined views of a chart can be viewed using this tool. This feature is only available when viewing 2D charts on a dashboard.
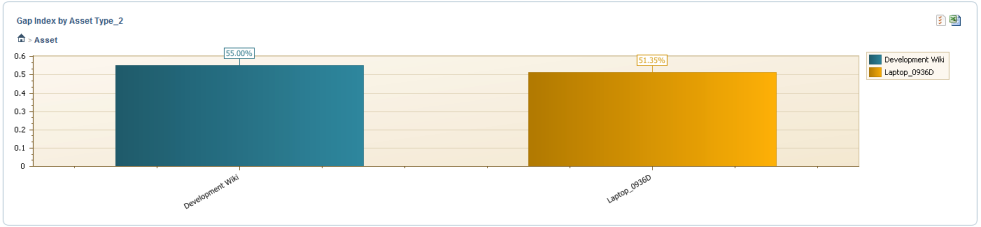
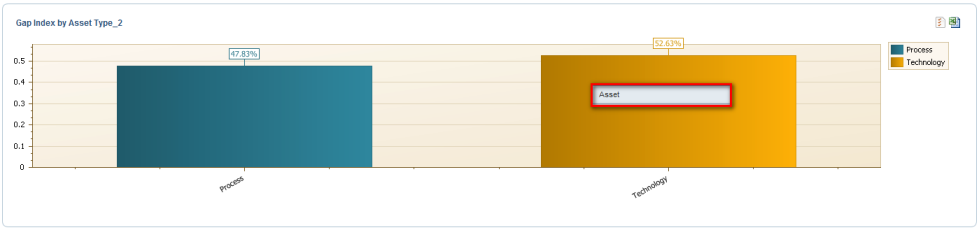
For example, suppose there is a chart showing the Gap Index by asset type. One of the asset types in the chart can be clicked so that you can drill-down and view which specific assets compose the Gap Index scores that were consolidated for the asset type. You can then drill-down further by clicking an asset and view the Gap Index scores for the asset’s components, and so on, when possible.
By selecting the drill-down option in the example above, you can view which assets comprise the type and how each contributed to the final Gap Index score (see figure below).