This topic explains how to use the drill-down feature to view more detailed information in a 2D chart by showing different levels of granularity.
Each indicator is associated with a set of dimensions, which are ways to consolidate indicators and which allow drill-downs to display different levels of consolidation.
Let’s consider a risk indicator used in the system, such as the Non-Implemented PSR, which is a numeric value that can be calculated for each control in a risk analysis. Once the PSR of a non-implemented control is calculated, this indicator can be consolidated for a knowledge base (by summing the PSR scores of all the non-implemented controls that comprise the knowledge base). This allows another metric to be obtained, which is the PSR of the non-implemented controls for the asset component with which the knowledge base is associated. This metric can then be consolidated again to obtain the PSR of the non-implemented controls for an asset (by summing the PSR of the non-implemented controls for all the asset’s components). With yet another consolidation, we can obtain the PSR of the non-implemented controls for an asset type (by summing the PSR of the non-implemented controls for all the assets of the type). Thus, a single metric can be calculated and viewed from different dimensions.
It’s important to understand that the possible dimensions vary for certain indicators. If a different indicator was selected in the example above (the Compliance Index, for example), the valid dimensions for this new indicator would be different. To ensure consistency between indicators and dimensions when creating charts, the system displays the available indicators (for each chart type) and, for each indicator, the system displays a list of possible dimensions in which the indicator can be consolidated.
1. Access the Dashboard module.
2. Select View Dashboards from the Dashboard Gallery option on the menu.
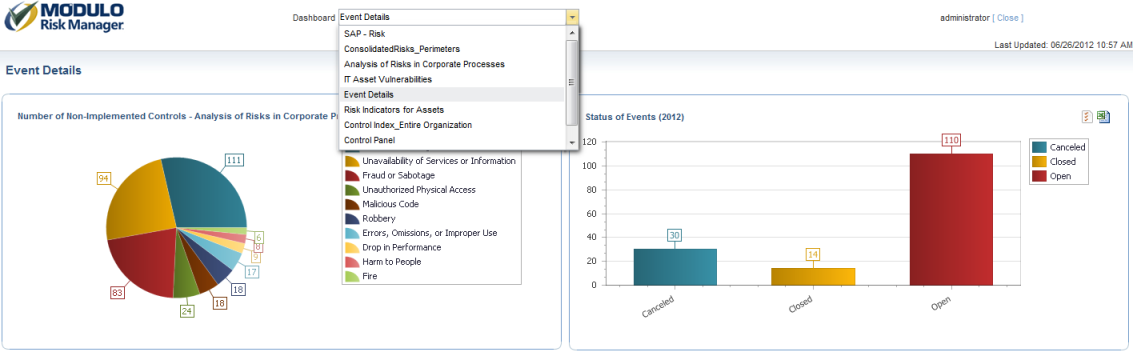
3. Select the dashboard containing the 2D chart that you want to view from the menu (see figure below).
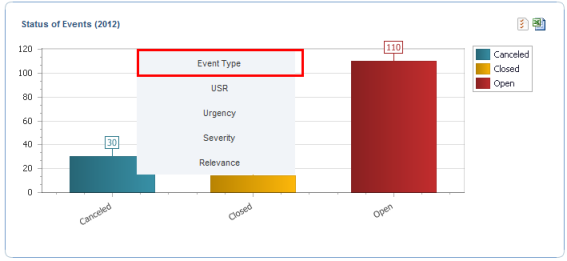
4. Click the section of the chart whose details you want to view using the drill-down feature and select the details you want to view from the list that appears (see figure below).
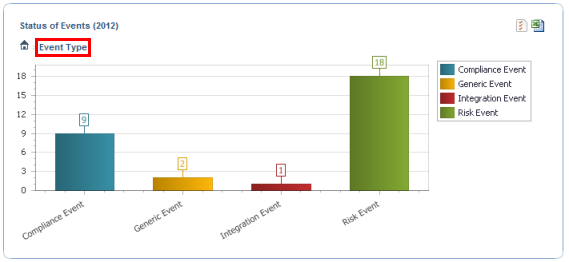
The system displays details on the object selected from the chart (see figure below).
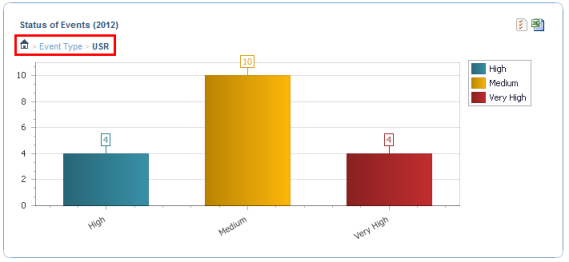
5. To view further details on a specific object, click the object and select the details you want to view from the list that appears. Note that the system displays the drill-down path in the upper left corner of the chart (see figure below).
Note: After a period of inactivity, the cache expires and the original chart is again displayed.