The charts displayed in dashboards are distributed in templates with different numbers of columns. These templates support up to four lines in three columns.
1. Access the Dashboard module.
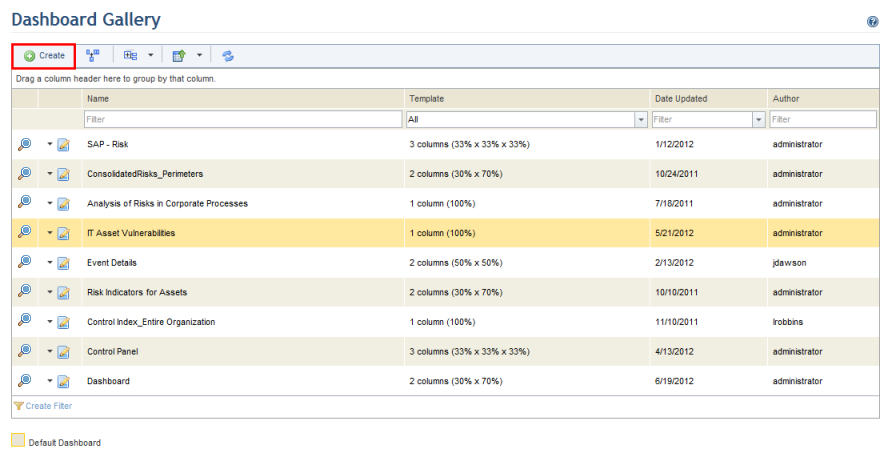
2. Select List Dashboards from the Dashboard Gallery option on the menu.
3. In the Dashboard Gallery section, click Create (see figure below).
The system displays a screen where the name of the new dashboard can be entered and the template to be used can be selected.
4. In the Dashboard Name field, enter a name to identify the dashboard. To set the dashboard to be displayed by default when the View Dashboards section is accessed, mark the Show by default checkbox.
5. Select a dashboard template from the available options (see figure below).
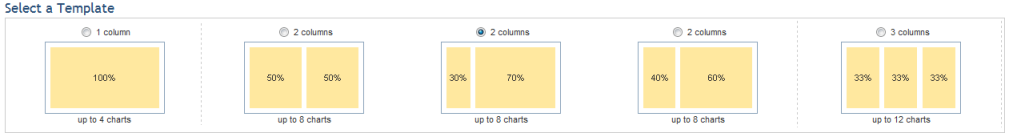
There are five templates available for dashboards:
•One column: a single area for arranging up to four large charts organized into a single column, showing one chart per line.
•Two 50%/50% columns: divides the dashboard into two columns of the same width and accepts up to eight charts with four per column.
•Two 30%/70% columns: divides the dashboard into two columns of different widths (30%/70%) and accepts up to eight charts, showing four per column. This is the default template.
•Two 40%/60% columns: divides the dashboard into two columns of different widths (40%/60%) and accepts up to eight charts, showing four per column.
•Three 33%/33%/33% columns: divides the dashboard into three columns of the same width and accepts up to twelve charts, showing four per column.
Note: Charts adapt to column sizes, but it’s important to check whether the charts are displaying the information clearly in the space allotted.
6. After selecting a template, click Save and Proceed. If you want to quit the operation, click Cancel.
The system displays the next step for creating the dashboard (see figure below).
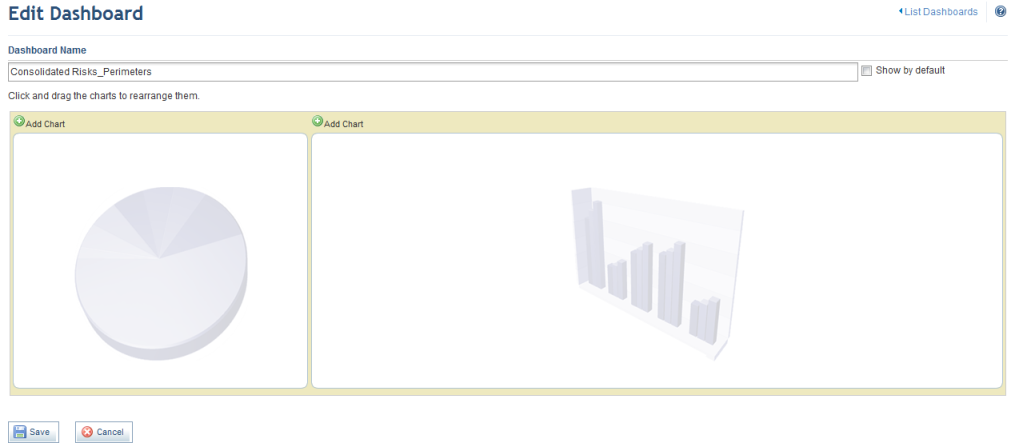
7. Click Add Chart.
8. Mark the checkboxes next to the charts to be added to the dashboard in the window that appears and then click Add Selected (see figure below). If you want to quit the operation, click Close.
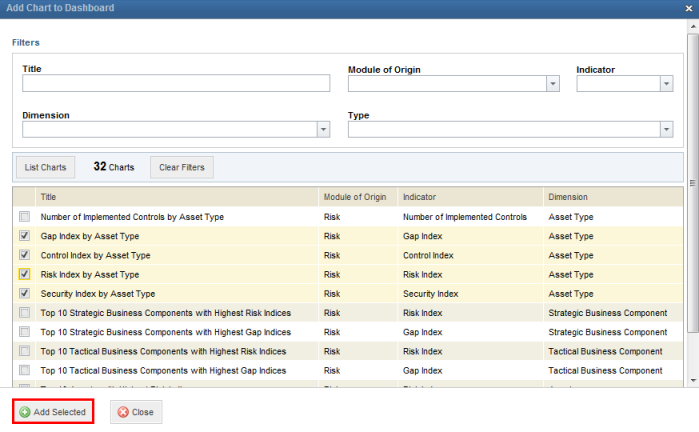
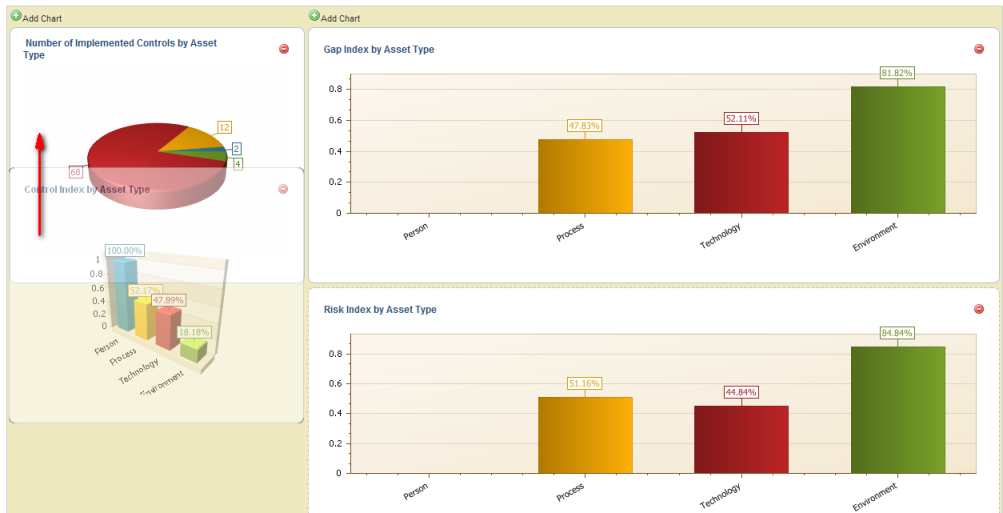
The system displays a screen with the charts added.
9. To rearrange the dashboard charts, click the chart you want to move and drag it to the desired location (see figure below).
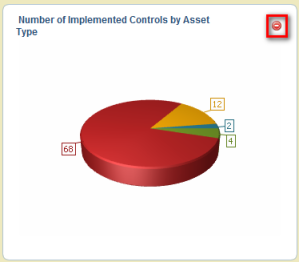
10. To remove a chart from the dashboard, click Remove in the upper right corner (see figure below).
The system requests confirmation to remove the chart (see figure below).
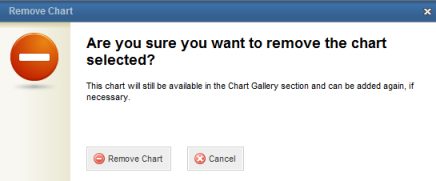
11. Click Remove Chart to confirm. If you want to quit the operation, click Cancel.
12. When finished selecting the charts for the dashboard, click Save. If you want to quit the operation, click Cancel.
The system displays a success message.