This section provides orientation on the features of the map in the Events solution. Through it, you can enable layers and view information on events, activities, and their routes; view any alerts for both upcoming activities and calls registered near them; as well as run simulations to view a list of activities and routes that may be affected by concurrent and nearby incidents.
In most system installations, certain layers (sets of information that can be plotted on the map) are provided by default with this solution, such as layers that display events according to when they are scheduled (for example, Events Today, Events this Month, etc.). However, other layers containing query results or additional maps can also be configured for use.
It is important to note that only layers based on queries of which you are author, editor, or an audience member will be available to you. For more information on layers, see Appendix -> Layers for the Integration Map.
The features to view alerts and to run simulations are specific to this solution. However, events and activities from this solution can also be displayed in the Integration and Dispatch solutions, since the default layers for events and activities are also available there.
Additional features that are common to the maps of the Integration and Dispatch solutions are also available for use here. These include selecting the map type and the layers to be displayed on the map; locating an address; listening to recordings of calls that have gone through a telecommunications network integrated with the system (on-demand integration); accessing the chat feature (on-demand); sending SMS messages (on-demand integration); drawing and managing shapes to be shown on the map; and accessing any other available windows. For details, see Chapter 15: Integration -> Common Features in the Map for the Integration Module and the Dispatch and Events Solutions.
Note that the features to play call recordings and send SMS messages will only be enabled if a radio or telecommunications network was integrated with the system and if you have the appropriate permissions in the Integration module. For further details, contact your account manager.
1. Access the Events solution.
2. In the Monitoring section, select View Event and Activity Map.
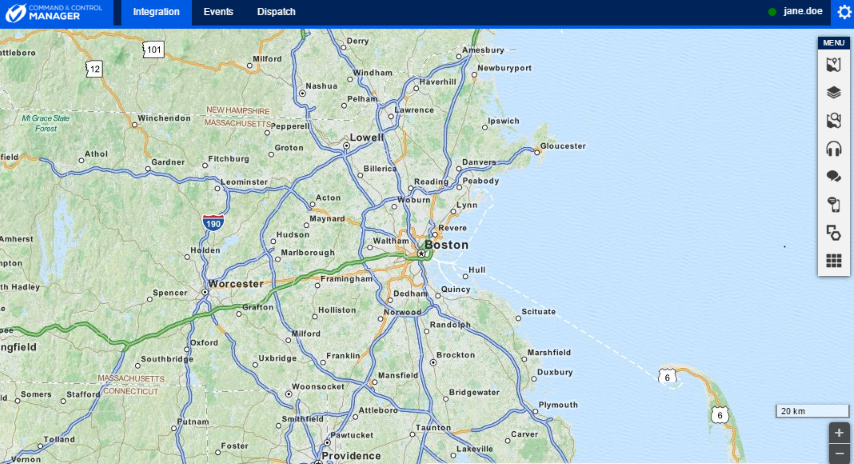
The system displays the map in a new window, where events and activities can be viewed geographically (see figure below).
3.
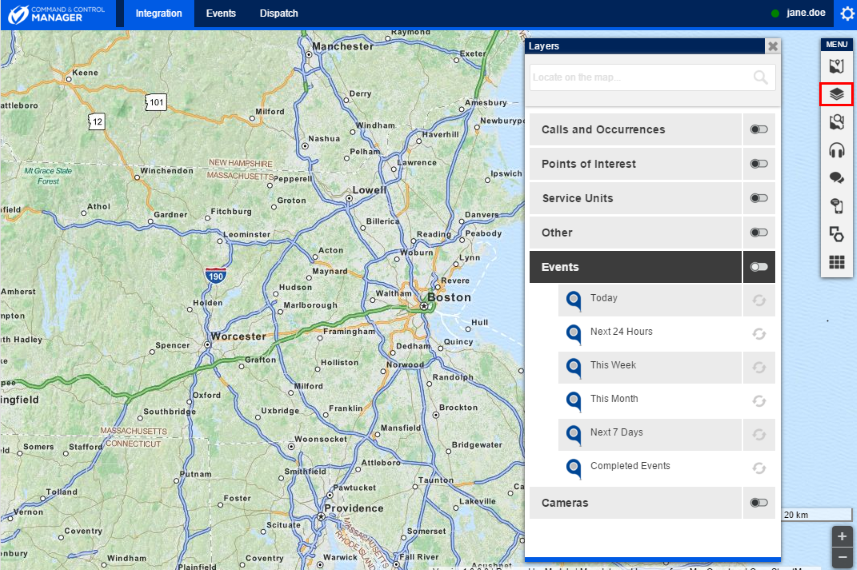
Click Layers ( ) and select the layers you want to
view on the map (see figure below). To enable an entire category of layers,
click the toggle button next to its name. Keep in mind that layers containing
scheduled events are provided by default with most system installations, but
that they may have to be configured manually. For details on configuring layers,
see Appendix -> Layers
for the Integration Map.
) and select the layers you want to
view on the map (see figure below). To enable an entire category of layers,
click the toggle button next to its name. Keep in mind that layers containing
scheduled events are provided by default with most system installations, but
that they may have to be configured manually. For details on configuring layers,
see Appendix -> Layers
for the Integration Map.
Note: The system will display an error message for a query layer if one or more columns (properties) configured as "required" in the XML file for configuring layers are either not included in the query or are included but left blank. For details, see Appendix -> Layers for the Integration Map -> How to Configure a Query Layer.
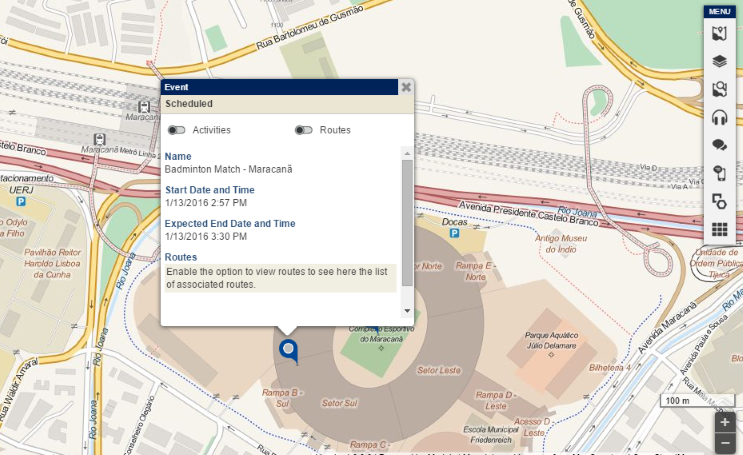
4. Click a pin on the map to view information on an object.
If you selected an event, a pop-up will appear displaying its properties and any enterprise risks associated with it (see figure below). All custom attributes created for it will also appear in the window, except for Attachment, Formula, Georeference, Image, List of Options, Outline, and Relationship attributes.
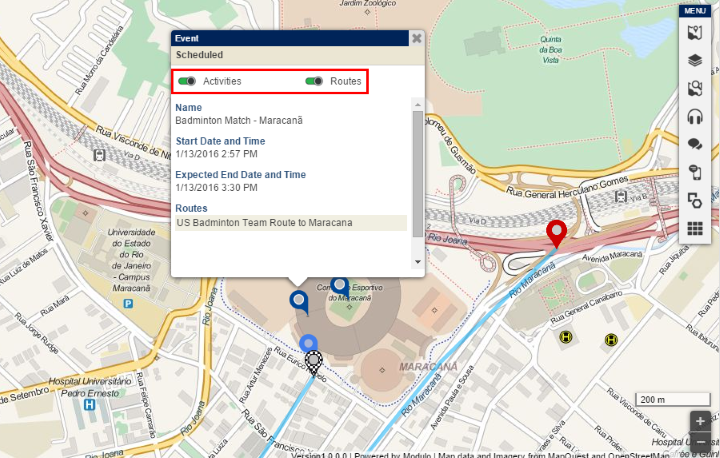
5. To view the activities and routes associated with the event selected, click their respective toggle buttons (see figure below). Once enabled, the activities and routes will continue to be displayed until they are disabled, even if the window is closed. A blue circle is displayed beneath the events for which one of these options is enabled.
Note: Pins for activities are displayed in light blue, and red and plaid pins indicate the start and end points of each route, respectively. By default, the main routes are displayed in blue and alternative routes are displayed in yellow; however, their colors can be edited manually. For details, see Chapter 14: Events -> Export/Import Scheduled Events, Available Resources, and Routes.
6.
Click Close ( ) in the upper right corner to
close the pop-up.
) in the upper right corner to
close the pop-up.
7.
To view any alerts configured for activities, click Windows ( )
and then Alerts in the pop-up that appears.
)
and then Alerts in the pop-up that appears.
The system displays a window where you can view the list of alerts with information on each activity, such as the start date and time, the group responsible, and the event to which the activity is related (see figure below). Alerts related to events that have been deleted will be displayed with "deleted" between parentheses next to them.
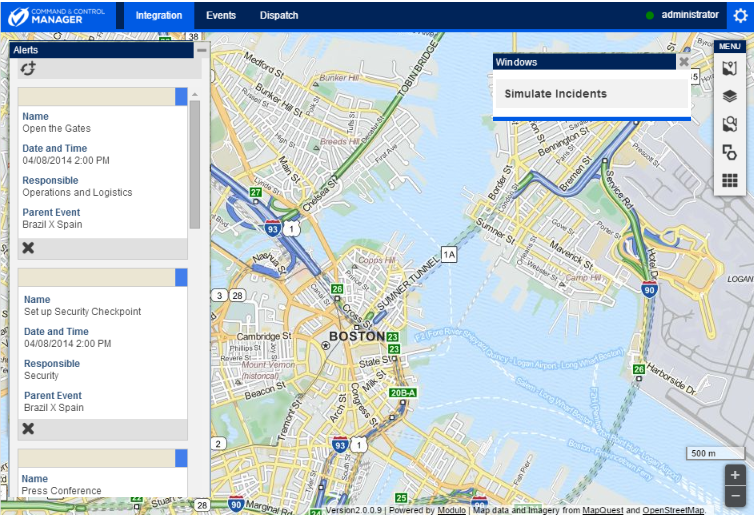
Note: Two types of alerts are available: when an activity is about to begin (shown with a blue tag) or when a call is registered near an activity with the "Scheduled", "Start Delayed", "In Progress", or "End Delayed" status (yellow tag).
For the first type, the time to display the alert is configured for each activity in the Manage Scheduled Events section of this solution.
For alerts to be generated by an activity's proximity to a call registered in the Dispatch solution, both the Events and Dispatch solutions must be enabled, and the maximum distance between calls and activities must be configured in the Timeline section. For more information, see Chapter 14: Events -> Monitoring Events and Activities -> How to View the Timeline.
8.
Click Load More ( ) to update the list of alerts.
By default, the system automatically updates the list of alerts every minute.
) to update the list of alerts.
By default, the system automatically updates the list of alerts every minute.
9.
To delete an alert, click Delete ( )
below the alert you want to delete.
)
below the alert you want to delete.
10. To simulate incidents and view any activities that may be affected, click Simulate Incident. This feature allows managers to take any necessary measures to prevent activities from being affected by nearby incidents.
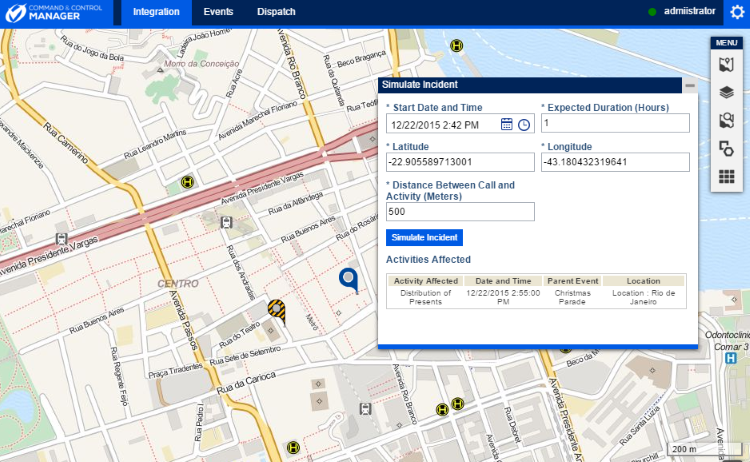
The system displays a window where you can enter information on a mock incident and view any activities that may be affected, with their routes plotted on the map (see figure below).
11.
In the Start Date and Time field, click Calendar ( )
and Time (
)
and Time ( ) and select the date and time when the
incident will take place.
) and select the date and time when the
incident will take place.
12. In the Expected Duration field, enter the amount of time, in hours, that the incident is expected to last.
13. In the Latitude and Longitude fields, enter the latitude and longitude of the incident. Note that the latitude and longitude must range from -90 to +90, and -180 to +180, respectively. The location can also be changed by dragging and dropping the pin to a new position on the map.
14. In the Distance Between Call and Activity field, enter the distance, in meters, between the location of the incident and the location of the activity. Any activities registered within this radius will be displayed.
15. Click Simulate Incident.
The system displays the activities that match the criteria selected, as well as their routes.