This chapter provides orientation on creating, publishing, and viewing dashboards and charts from the Dashboard module.
Given the profile of the corporate world, decisions have strategic importance and must be direct and proactive. A way to assist decision makers is to generate indicators, which facilitate analysis of the results obtained in the organization’s processes, and to display these indicators in charts. It should also be possible for these indicators to be queried at different levels of detail – that is, with greater or lesser degrees of consolidation.
The Dashboard module offers solid support for organizational governance by allowing the graphic display of the various indicators generated by the GRC processes managed by the system, as risk and compliance projects generate indicators and as event indicators are generated in the Workflow module. These indicators represent system metrics and are expressed in numeric values.
In this chapter you will learn how to create and edit charts for various default risk, vulnerability, compliance, and event indicators, as well as how to create custom charts by selecting a data source and specifying this information through a query. An audience can be defined for each chart so that its members can view (with the same permissions as the author) and edit the chart through this module, if they have permission to access it.
Information is also provided on how to assemble dashboards using these customized charts. Similarly to charts, people and groups can be included in the audience of a dashboard so that they can view it with the same permissions as the author through the Dashboards section of the Home module, as well as in the Dashboard module, if they have permission to access it. You will also learn how to apply filters and perform drill-down operations in 2D charts (when available) in order to view data with different levels of detail (consolidation) based on a set of dimensions.
It is important to note that in order for this module to have data to display, you must first create an integration task with it (see Chapter 17: Administration -> Integrations -> Integration Tasks -> Creating an Integration Task for the Dashboard module). The Dashboard module uses a separate database that must be integrated with the main system database and routinely updated so that only the most recent information on the charts is displayed.
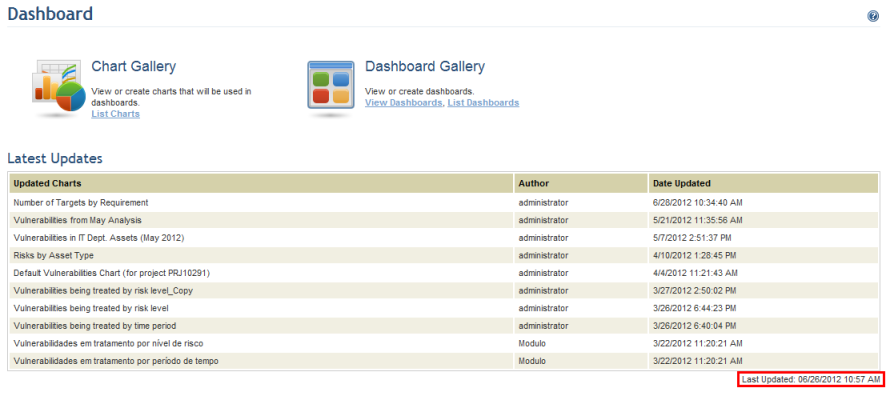
The system displays a notification informing whether or not the Dashboard module was integrated and, if so, the time it was last updated. If a project or event was created after the date it was last updated, then you know the integration task needs to be executed in order to generate the chart containing updated information on it.