
This topic provides orientation on using Dashboard Designer features and tools. The tool groups have been divided according to the sections of each tab of the program.
•Home
|
Section |
Feature |
Description |
|
File |
Open/Create |
Opens the window that allows you to select an existing dashboard or create a new dashboard. |
|
Save |
Saves changes to the dashboard that is being edited. | |
|
Save as |
Saves the dashboard to a new file. Through this option you can rename the dashboard and keep its title or not. | |
|
View |
Displays the dashboard in the Data Analytics module, for viewing purposes. Option available for saved dashboards only. | |
|
History |
Undo |
Undoes the last operation. |
|
|
Redo |
Redoes the last operation. |
|
Insert |
|
This section allows you to insert the dashboard items. For an overview of these items, see Dashboard Designer – User Manual-> Dashboard Items. |
|
Item (only appears after an item of the Insert section is included in the dashboard) |
Duplicate |
Creates an item identical to the one selected in the dashboard. |
|
|
Delete |
Deletes the selected item from the dashboard. |
|
|
Remove Data Items |
Removes all data included in the item. |
|
|
Transpose (available only for charts) |
Rotates a chart so that the X-axis becomes vertical and the Y-axis becomes horizontal. |
|
|
Convert to |
Converts an item to another, displaying its data in the format of the new item. |
|
|
Editar Rules |
Allows you to edit, delete, rearrange, filter, and create formatting rules used in the dashboard item. Available only for Grid items. |
|
Dashboard |
Title |
Defines the dashboard title, with options to make it visible, set the alignment, and insert image. |
|
|
Currency |
Defines the currency and culture of the monetary values used in the dashboard. |
|
|
Edit Colors |
Allows you to create color schemes with specific colors for the data source fields. |
|
|
Automatic Updates |
Enables automatic updates of the data sources so the dashboard displays the latest information. |
|
|
Update |
Updates the data sources. |
•Data Source
|
Section |
Feature |
Description |
|
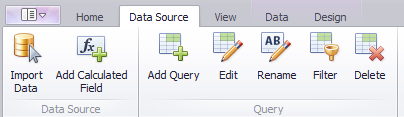
Data Source |
Import Data |
Opens the Data Source Management window, where you can select and download new data sources to the dashboard. |
|
Add Calculated Field |
Allows you to create complex expressions from other fields in the data source. You can use in the expressions operators, data source fields, constants, and many other functions to, for example: calculate a date, transform a text type field into numeric, or even create a field that calculates the discount offered in sales, for example. | |
|
Query |
Add Query |
Allows you to create new data sources from existing data sources through Query Builder. |
|
|
Edit |
Opens the Query Builder, where you can edit the data sources created through the wizard. |
|
|
Rename |
Opens a window where you can rename the query. |
|
|
Filter |
Opens the Filter Editor, where you can apply filters to your query data. |
|
|
Delete |
Removes the query used as the data source from the dashboard. |
•View
|
Section |
Feature |
Description |
|
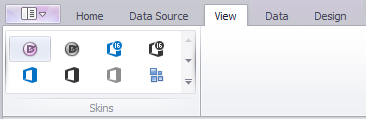
View |
|
Allows you to change the layout of the program. Several layouts are available for selection. |
•Data
|
Section |
Feature |
Description |
|
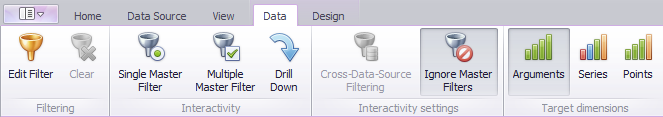
Filtering |
Edit Filter |
Allows you to apply specific filters to a dashboard item. Note that this feature is different from the Filter feature of the Query tab. The filters applied here are specific to a dashboard item, while the query filter is applied to the data source, therefore displaying the filters on all items that use the query. |
|
Clear |
Clears the filters included in the item. | |
|
Interactivity |
Single Master Filter |
Enables the master filter. When you select a field from a dashboard item, other dashboard items will display only the data corresponding to the field selected in the filter. |
|
|
Multiple Master Filter |
Enables the multiple master filter. When you select multiple fields from a dashboard item, other items of the dashboard will display only the data corresponding to the fields selected in the filter. |
|
|
Drill Down |
Allows you to increase the level of detail of the fields displayed in an item on the dashboard. |
|
Interactivity settings |
Cross-Data-Source-Filtering |
Applies the master filter between different data sources. When different items in a dashboard are linked to different data sources, you can specify that a particular master filter should be applied across all data sources. This means that it will apply filtering to fields with matching names in all data sources. For this feature to work correctly, data sources must contain fields with the same name among them so that the system can use them as a connection field between the data sources. |
|
|
Ignore Master Filters |
Specifies that a dashboard item will not be affected by the master filters of other items. |
|
Target dimensions (available for charts) |
Arguments |
Indicates that the chart arguments will be used as criteria in the master and drill-down filters. |
|
|
Series |
Indicates that the chart series will be used as criteria in the master and drill-down filters. |
|
|
Points |
Indicates that the chart points will be used as criteria in the master and drill-down filters. |
•Design
|
Section |
Feature |
Description |
|
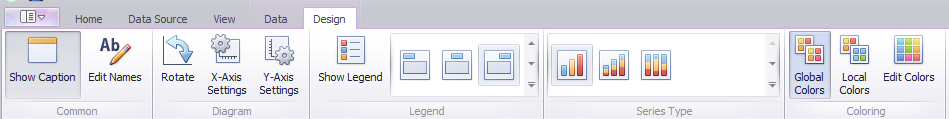
Common |
Show Caption |
Enables the caption of a dashboard. |
|
|
Edit Names |
Allows you to edit the titles of dashboard items. |
|
Diagram (available for charts) |
Rotate |
Rotates a chart so that the X-axis becomes vertical and the Y-axis becomes horizontal. |
|
|
X-Axis Settings |
Opens a window where you can set x-axis customization options, such as displaying its title and enabling zooming. |
|
|
Y-Axis Settings |
Opens a window where you can set y-axis customization options, such as displaying its title and reversing the bar layout of the chart. |
|
Legend (available for charts) |
Show Legend |
Allows you to display caption on dashboard items, as well as define its position. |
|
Series Type (available for charts) |
|
Allows you to choose the series type of the chart. |
|
Coloring |
Global Colors |
Allows you to use a standardized color scheme for identical values in the dashboard. Colors can only be used in the following items: charts, pie charts, scatter charts, interval filters, and pie charts. |
|
|
Local Colors |
Allows you to use an independent color scheme for a dashboard item. |
|
|
Edit Colors |
Allows you to create your own color scheme for a dashboard item. |
Note: Additional options for maps can be displayed in the Design tab. Note that the size limit for shapefile map files (.shp) is 5 MB per dashboard. If more than one map file is imported into the same dashboard, the sum of the file sizes cannot exceed this limit.