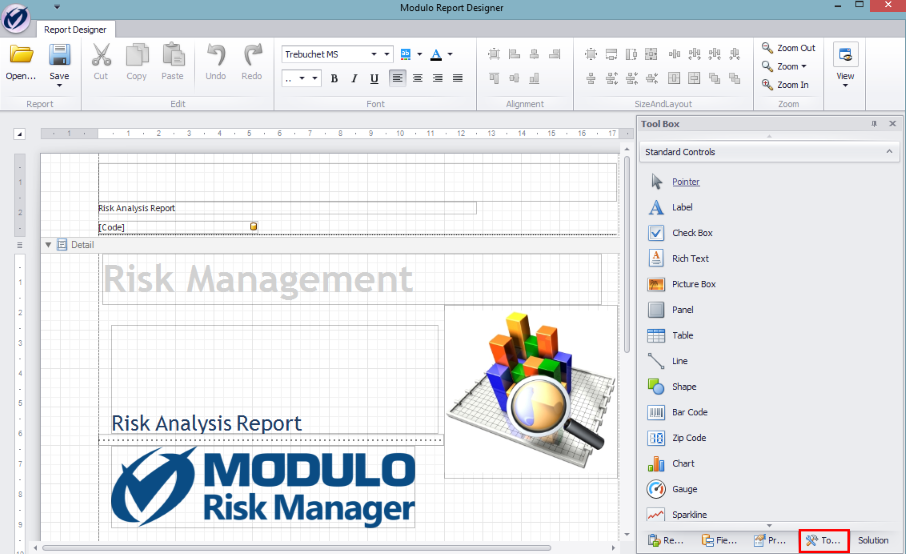
A control represents any element that can be included in the report template, such as text, images, a dividing line, a checkbox, etc. Controls are normally included within bands, although controls can also be created within certain controls (for example, a panel). The appearance and behavior of the controls depends on its type. The Tool Box window lists the types of controls available in Report Designer.
To use a control, click and drag it from the Tool Box window to the editing area. The figure below shows the use of a Line control, which allows lines to be included within the report bands.
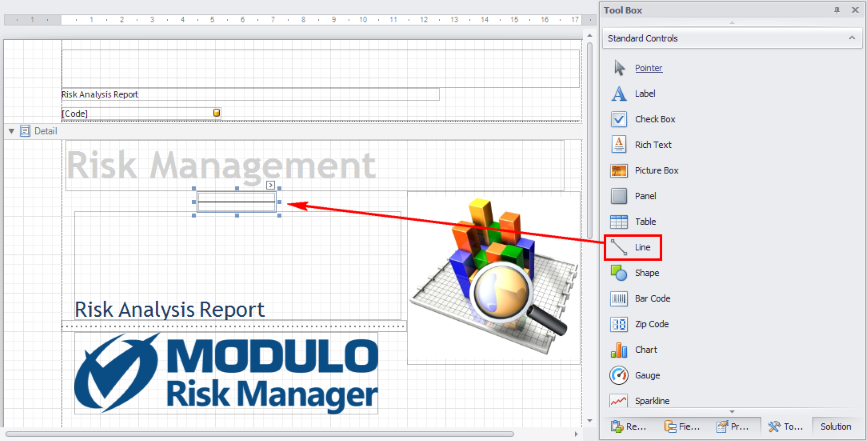
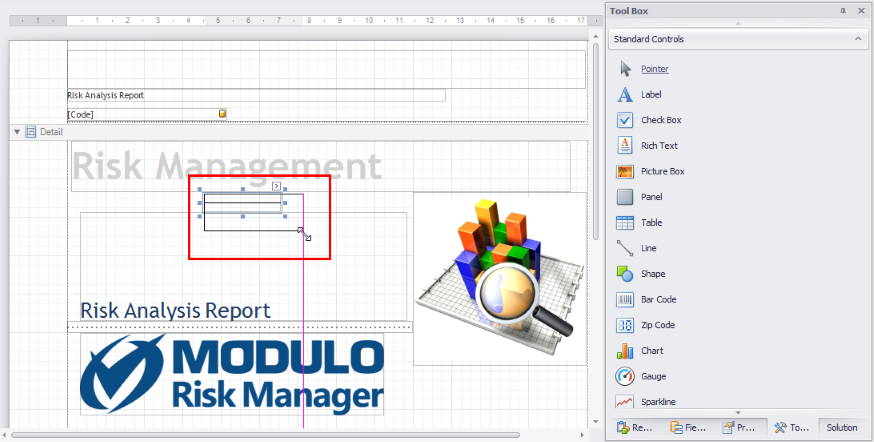
Controls can be resized once positioned in the editing area by dragging the markers around its edges. The figure below shows a resized Line control in the ReportHeader band in a report template being edited.
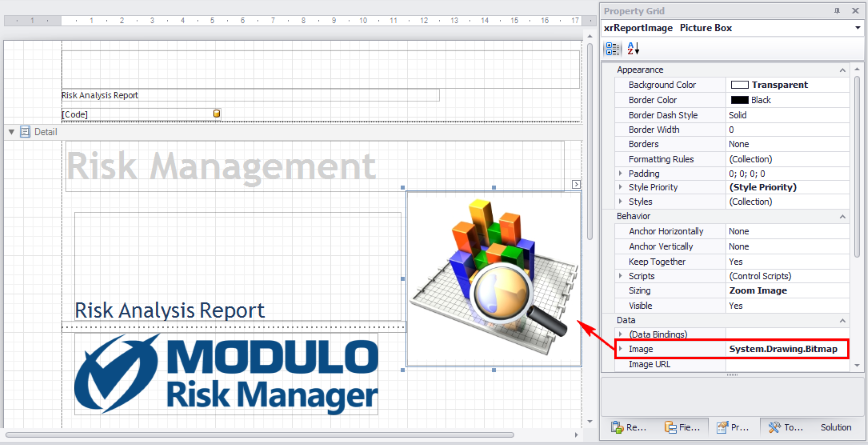
Once a control is selected within a band, the Property Grid window shows its properties. For example, the Image property allows an image to be selected that will be displayed through a Picture Box control. The image can be stored locally on your computer or on a network directory.
Properties are organized into groups in the Property Grid window, as explained below:
|
Property Group |
Description |
|
Appearance |
General appearance of the control, including color, background color, borders, styles, etc. |
|
Behavior |
General behavior of the control, including visibility, associated scripts, if the size of the control can be modified, etc. |
|
Data |
Information the control should display, both static (manually entered) and dynamic (read from a data source). |
|
Design |
Control name. |
|
Layout |
Location (coordinates of the control’s position in the editing area), size, etc. |
|
Navigation |
URLs and bookmarks associated with the control. |
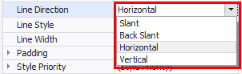
Although many properties are common to various controls, there are also properties specific to each type of control. For example, Line controls include a Line Direction property which determines the line’s orientation (inclined, horizontal, or vertical), but this property is not applicable to other types of controls.
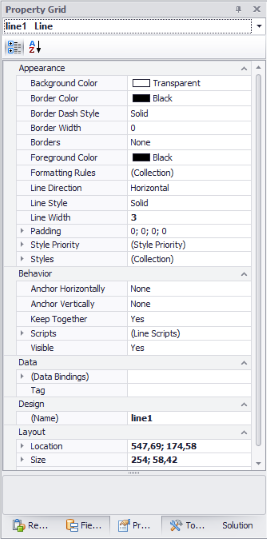
It may also be that one of the groups listed above is not available for a certain type of control. For example, the Navigation group of properties does not appear for Line controls. The figure below shows the properties that are available for Line controls, and, again, not all of these will be available for other types of controls.
There are a number of properties available for the different types of controls, and therefore not all of these will be discussed in detail. However, some of these properties are detailed in Report Designer – User Manual -> The Toolbox and Properties Windows -> How to Create Customized Tables.
To help you become familiar with the controls, each of them will be presented with a summary and some examples of their more interesting properties.
When right-clicking a control, a dropdown menu appears with some additional operations available (see figure below).
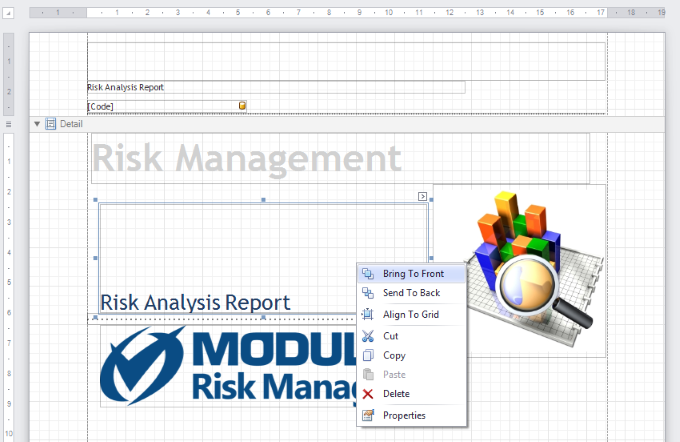
The Bring to Front and Send to Back options put the control selected either in front or behind (partially hidden) other controls, allowing you to decide what should be highlighted in each band in the case of overlapping controls.
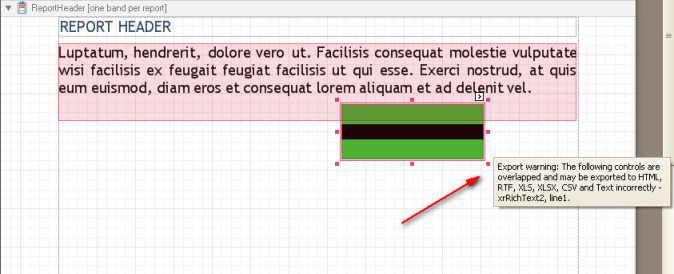
The Align to Grid option automatically aligns the control to the editor’s grid. Note, however, that in general it’s best not to let controls overlap in the report’s bands, since this may produce errors when the report is generated in certain formats. The editor indicates when controls are overlapped by showing an export warning (see figure below).
Controls can also be cut (Cut), copied to the clipboard (Copy), pasted to the editing area (Paste), and deleted (Delete).
Note: The editor does not display any alerts or request confirmation before deleting a control. You can use the Undo command on the toolbar to undo this operation, and the Redo command automatically redoes the last operation.
The Insert Band and Insert Detail Report options are not normally applicable to traditional controls but rather to the reports themselves. They allow new bands to be included in the report and detail reports to be included within existing bands.
The Zoom option allows you to view the template from closer up or further back, which is useful for previewing an entire page or viewing details of a control.
Finally, the Properties option on the context menu displays the Property Grid window for the control selected, where its properties can be viewed and edited.