 ) to display the Report Tasks
window.
) to display the Report Tasks
window.This section explains how to create and view customized tables in reports, using the queries available in the Field List window. These tables can have columns whose values are calculated and inserted in the report when it is generated. In addition, SQL queries registered in the system under the Manage Templates option in the Reports section of the Organization, Risk or Compliance modules will also be available as tables in this window, and can be used to create customized tables.
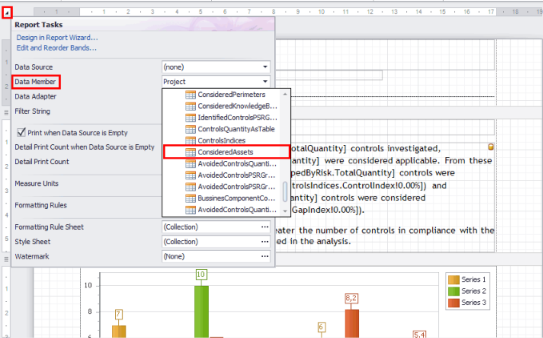
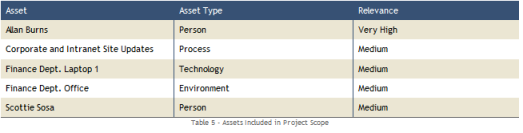
To illustrate how to create customized tables, the "ConsideredAssets" table will be selected. This table is comprised of the Relevance, RelevanceName, AssetName, and AssetTypeName columns, which will be completed with relevant information on each asset.
1. Open an .mrep file exported through the system and click the Solution window.
2. Double-click on the page of the report in which the table will be included.
3.
Click the arrow in the upper left corner of the report () to display the Report Tasks
window.
4. In the Data Member field, select the "ConsideredAssets" table and click off the window to hide it (see figure below).
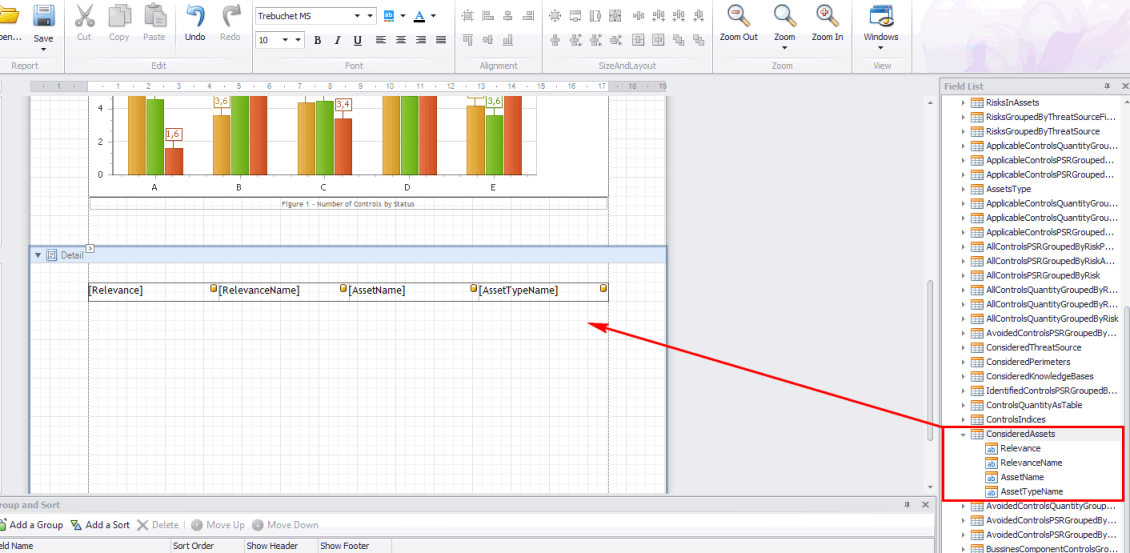
5. In the Field List window, click the "ConsideredAssets" item and drag it to the Detail band in the report (see figure below).
Note: The table can also be added through the Table feature from the Tool Box window. After the control is included in the report, its cells must be linked to the corresponding columns of the desired table (in this case, ConsideredAssets). To do so, click the arrow in the upper right corner of a cell and select in the Data Binding field the column to be linked.
6. You can delete columns that are not needed from your report. To do so, right-click the column and click Delete.
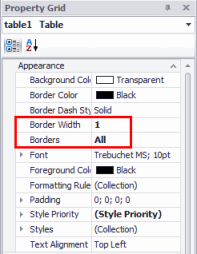
7. Select the table and click the Property Grid window.
8. In the Appearance group, you can change the width of the table borders through the Border Width property.
9. In the Appearance group, you can change the value of the Borders property to "All" so that the borders of all the cells are displayed (see figure below).
10. The Background Color, Border Color, and Foreground Color can be used to define the colors to be used in the background, border, and font of the table, respectively. The colors can be selected from the list or RGB values for the desired color can be inserted separated by semicolon.
11. The Padding field allows spacing between content and table borders to be defined. The Bottom, Left, Right, and Top fields allow the spacing between the content and the lower, left, right, and upper borders to be defined, respectively. In addition, the All field allows for all the borders to have the same spacing.
12. In Styles, you can define different styles for even and odd lines (Even Style and Odd Style, respectively). This feature is useful, for example, to build a table with interspersed colors.
Note: The table must be included in the Detail band, the only band that can be repeated according to the number of entries returned when a report is generated. For example, if the scope of a project includes ten assets, the Detail band will be repeated ten times.
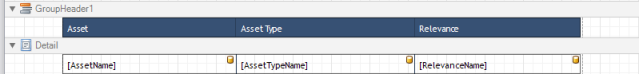
13. To add a header to the customized table, simply add another table to the GroupHeader band above the Detail band and adjust it so that it has the same number of columns and the same width as the customized table (see figures below).
14. For the header to be repeated in all pages, click the arrow in the upper right corner of the GroupHeader and mark the Repeat Every Page checkbox.