Chart Types
This topic describes the types of charts available in the
system and the situations in which they can be used. The type of a chart is
selected in the second step of the wizard for creating charts. For details on
creating charts, see Chapter 9: Dashboard -> How to Create a Chart and How to Create a Custom Chart.
Each type of chart best illustrates a certain kind of
information. For example, bar charts are used to compare quantities, pie charts
to measure percentages, and so on. The table below lists all of the chart types
available in the system.
|
Types |
Names |
|
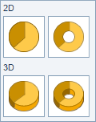
Pie
|
Four types of pie charts are
available:
•
Pie
•
Doughnut
•
3D Pie
•
3D Doughnut |
|
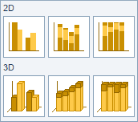
Bar
|
Six types of bar charts are
available:
•
Bar
•
Stacked Bars
•
Full Stacked Bars
•
3D Bar
•
3D Stacked Bars
•
3D Full Stacked Bars |
|
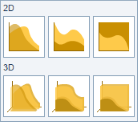
Area
|
Six types of area charts are
available:
•
Area
•
Stacked Area
•
Full Stacked Area
•
3D Area
•
3D Stacked Area
•
3D Full Stacked Area |
|
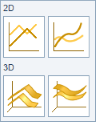
Line
|
Four types of
line charts are available:
•
Line
•
Curved Line
•
3D Line
•
3D Curved Line |
|
Other
|
Four other types of charts are
available:
•
Radar Scatterplot
•
Radar Line
•
Radar Area
•
Scatterplot |
The chart types that can be used in chart depend on the
indicator selected for it (except in the case of custom charts, which do not use
indicators). The table below illustrates which chart types can be used in risk,
vulnerability, compliance, and Workflow charts, depending on the indicator
used.
|
Types |
Indicator |
Available Chart
Types |
|
Risk
|
|
|
|
|
Control
Index |
Bar
3D
Bar
Line
3D
Line |
|
|
Controlled
PSR |
Pie
3D
Pie
Doughnut
3D
Doughnut
Bar
3D
Bar
Line
3D
Line
Radar Line
Radar Area |
|
|
Gap Index |
Bar
3D
Bar
Line
3D
Line |
|
|
Identified
PSR |
Pie
3D
Pie
Doughnut
3D
Doughnut
Bar
3D
Bar
Line
3D
Line
Radar Line
Radar Area |
|
|
Non-Applicable
PSR |
Pie
3D
Pie
Doughnut
3D
Doughnut
Bar
3D
Bar
Line
3D
Line
Radar Line
Radar Area |
|
|
Number of
Implemented Controls |
Pie
3D
Pie
Doughnut
3D
Doughnut
Bar
3D
Bar
Line
3D
Line
Radar Line
Radar Area |
|
|
Number of
Non-Applicable Controls |
Pie
3D
Pie
Doughnut
3D
Doughnut
Bar
3D
Bar
Line
3D
Line
Radar Line
Radar Area |
|
|
Number of
Non-Implemented Controls |
Pie
3D
Pie
Doughnut
3D
Doughnut
Bar
3D
Bar
Line
3D
Line
Radar Line
Radar Area |
|
|
Risk
Index |
Bar
3D
Bar
Line
3D
Line |
|
|
Security
Index |
Bar
3D
Bar
Line
3D
Line |
|
Vulnerabilities |
|
|
|
|
Number of
Vulnerabilities |
Pie
3D
Pie
Doughnut
3D
Doughnut
Bar
3D
Bar
Line
3D
Line
Radar Line
Radar Area |
|
|
Risk
Score |
Pie
3D
Pie
Doughnut
3D
Doughnut
Bar
3D
Bar
Line
3D
Line
Radar Line
Radar Area |
|
Compliance |
|
|
|
|
Compliance
Index |
Bar
3D
Bar
Line
3D
Line
Radar Line
Radar Area |
|
|
Number of
Objects |
Pie
3D
Pie
Doughnut
3D
Doughnut
Bar
3D
Bar
Line
3D
Line
Radar Line
Radar Area |
|
Workflow |
|
|
|
|
Number of
Events |
Pie
3D
Pie
Doughnut
3D
Doughnut
Bar
3D
Bar
Line
3D
Line |
For custom charts, the chart types accepted vary according to
the type of SQL query selected, as detailed in the table below.
|
Type of SQL Query |
Available Chart Types
|
|
Default |
Pie
3D Pie
Doughnut
3D Doughnut
Bar
3D Bar
Line
3D Line |
|
With identifier |
Pie
Doughnut
Bar
Line |
|
With time |
Bar
3D Bar
Line
3D Line |
|
With three values |
Stacked Bars
3D Stacked Bars
Full Stacked Bars
3D Full Stacked Bars
Scatterplot |
|
With three values and an
identifier |
Stacked Bars
Full Stacked Bars
Scatterplot |