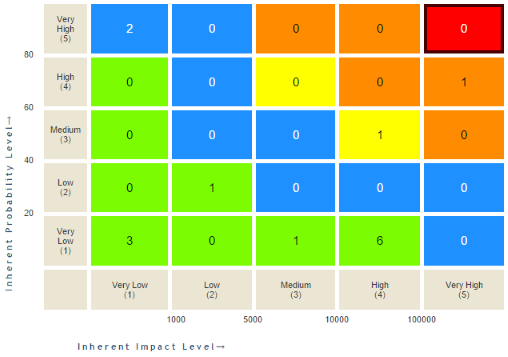
This section provides information on the risk matrix, where risks are distributed according to the inherent impact and inherent probability levels, or according to the residual impact and residual probability levels. This allows more critical risks to be easily identified. Each cell of the risk matrix displays a value that indicates the number of risks relative to that cell. When clicking a cell, a list with details on these risks is displayed.
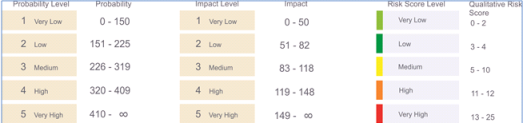
Note that each risk has an inherent and residual probability and an inherent and residual impact. The possible values for these attributes can be classified on a five level scale. For each level, the lower and upper limits, the colors for the level, a name, and a description can be defined. The risk matrix uses the levels and not the values entered in these fields.
The colors used in the risk matrix are determined by the levels of the Qualitative Risk Score, which is obtained by multiplying the probability level by the impact level. Since these levels range from 1 to 5, the levels for the Qualitative Risk Score can range from 1 to 25. Similar to the probability and impact levels, the Qualitative Risk Score levels are determined by scales configured in the Scales section of the Administration module and configured on the risk matrix page. All default and customized scales are available in the ERM solution so that you can select those you want to be displayed in the matrix.
For example, consider a risk with a probability of 157 and an impact of 3. The Qualitative Risk Score is obtained by multiplying these two values. The result is not displayed in the risk matrix, but it can be viewed in the list that appears after clicking a cell.
In the example, a probability of 157 and an impact of 3 correspond, respectively, to a Low and Very Low in their corresponding qualitative scales. Also according to these scales, these levels are given the 2 and 1 values, respectively.
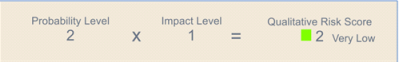
The Qualitative Risk Score is the result of the product of these two values, which, in this case, is 2. This value corresponds to the Very Low level of the qualitative scale for the Risk Score, represented by the light green color.
The risk is then displayed in the risk matrix cell that corresponds to the Low probability level, the Very Low impact level, and to the Very Low level in the Qualitative Risk Score. The values inside the cells indicate the number of risks that fall in the corresponding levels of each cell.