This topic explains how to use the Assets section from the Organization module to view the vulnerabilities consolidated for a perimeter that includes technology assets.
By integrating QualysGuard and NeXpose with Modulo Risk Manager, information on vulnerabilities in technology assets identified by these scanners can be viewed. An integration task with each respective scanner must be created for this, and the system must be able to correctly match the vulnerabilities identified for each machine analyzed by the scanners to the corresponding assets in the system. Vulnerabilities identified by scanners not supported by the system can also be imported manually to the catalogue of vulnerabilities and mapped to assets through spreadsheets. Mapping criteria can be specified in the Asset Mapping Criteria section of the Properties tab for perimeters or for each asset individually.
When accessing the Vulnerabilities tab for a perimeter, the system will display consolidated information on vulnerabilities found in the technology assets of the perimeter selected. If the perimeter contains no technology assets or if no vulnerabilities were mapped to them, no information will be available. This tab can also be hidden for perimeters by system administrators in the Display Options section of the Administration module.
For details on integration tasks to automatically import and map vulnerabilities from scanners supported by the system to assets, see Chapter 17: Administration -> Integrations -> Integration Tasks. For details on importing vulnerabilities to the catalogue, see Chapter 8: Knowledge -> Risk Knowledge -> Catalogue of Vulnerabilities. Lastly, for details on manually mapping vulnerabilities from scanners not supported by the system to assets, see Chapter 5: Risk -> Vulnerability Occurrences.
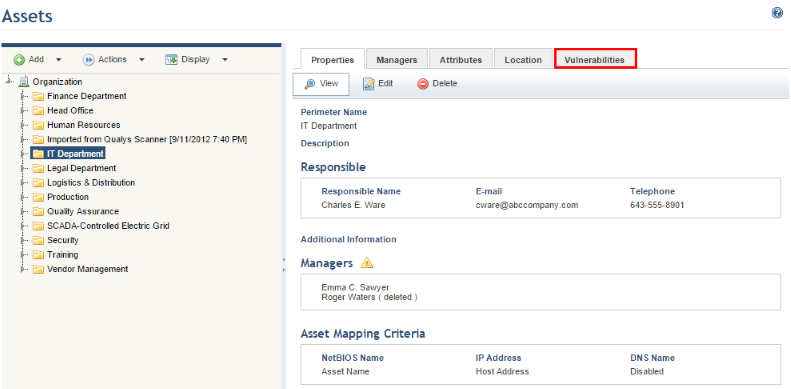
1. Access the Organization module.
2. Select the Manage Assets option from the Assets menu.
3. In the Assets section, click the perimeter whose consolidated vulnerabilities you want to view.
4. Click the Vulnerabilities tab (see figure below).
The system displays two graphs and the list of vulnerabilities identified (see figure below). Note that, if there is no data for potential vulnerabilities, or if a scanner does not support this type of vulnerability, the potential vulnerabilities graph will not be displayed.
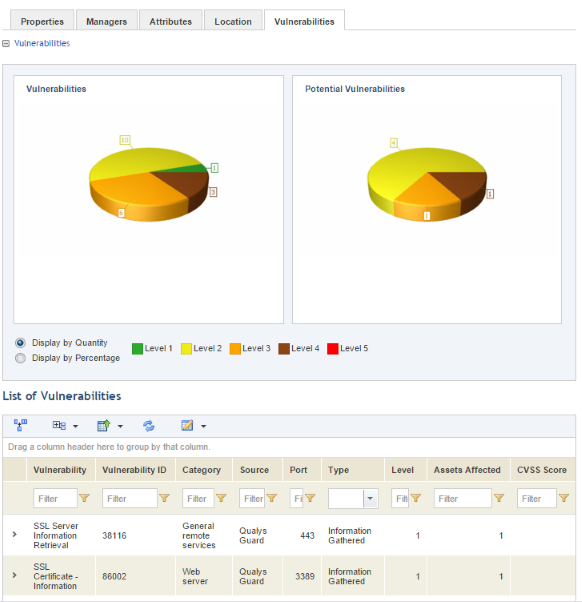
Note 1: The graphs indicate the number of vulnerabilities and potential vulnerabilities last identified and which have not yet expired for each technology asset within the perimeter. By default, it is displayed by quantity, but can also be displayed by percentage by selecting Display by Percentage.
Note 2: Details on the vulnerabilities are displayed
by clicking Expand ( ) next to each (see figure below).
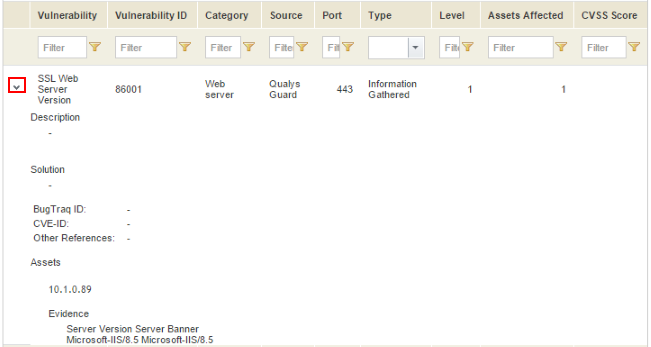
The table below provides further information on the details displayed for each vulnerability:
|
Vulnerability Details |
Description |
|
Description |
Provides the description of the vulnerability found. |
|
Solution |
Indicates the most appropriate solution to resolve the vulnerability. |
|
Bugtraq ID |
Corresponding Bugtraq identification code of the vulnerability. |
|
CVE-ID |
Corresponding CVE identification code of the vulnerability. |
|
Other References |
Indicates where further information on the vulnerability in question can be found. |
|
Assets |
Lists the assets in which the vulnerability was found for which evidence will be displayed. |
|
Evidence |
Displays information that provides direct evidence of the existence of the vulnerability. |
Note 3: The information displayed in each column is explained below:
•Vulnerability: lists the name of the vulnerability identified by the scanners.
•Category: indicates the group of vulnerabilities to which the vulnerability in question belongs. Note that the NeXpose scanner does not use categories, thus in this case only the scanner name will appear in this column.
•Source: indicates the scanner used to perform the vulnerability analysis.
•Port: indicates the port used to access information and identify vulnerabilities for the technology assets.
•Type: the three types of vulnerabilities include Information Gathered (additional information collected on the technology asset), Potential Vulnerability (possible, unconfirmed vulnerabilities), and Vulnerability (confirmed vulnerabilities).
•Level: indicates the vulnerability’s severity level using a metric that consolidates the three different metrics used by the scanners that were integrated with the system. The consolidation of these levels is shown in the table below:
|
QualysGuard Level: |
NeXpose Level: |
Modulo Risk Manager Level: |
|
1 |
1 – 2 |
1 |
|
2 |
3 – 4 |
2 |
|
3 |
5 – 6 |
3 |
|
4 |
7 – 8 |
4 |
|
5 |
9 - 10 |
5 |
•Assets Affected: indicates the number of technology assets in the perimeter that were affected by the vulnerability.
•CVSS Score: indicates the Common Vulnerability Scoring System, created by the National Infrastructure Advisory Council (NIAC). This is an index from 0 to 10 that determines the urgency, priority, and severity of the vulnerabilities encountered. The CVSS Score can be one of three types (base, temporal, or environmental). The type used by the system is CVSS base metrics.
•Protocol: indicates the network protocol associated with the vulnerability (for example, TCP).
•Last Updated: indicates the last time the data collected was updated in the system.
•Vulnerability ID: displays the unique identifier of the vulnerability, allowing vulnerabilities under the same name to be identified. The format of the identifier may be different depending on the scanner used.