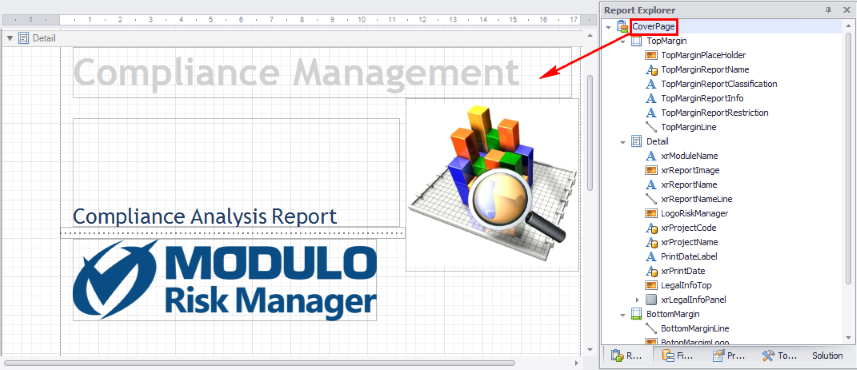
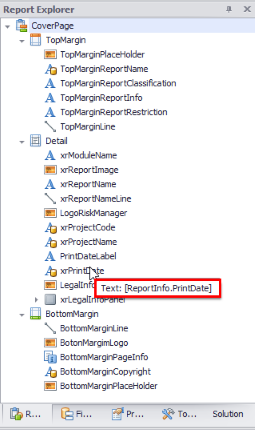
Once a certain page has been selected for editing, the Report Explorer window allows you to navigate between its elements, allowing you to quickly access the bands on the page and the controls included within each band. In the figure below, the "CoverPage" page is selected for editing from the Report Explorer window.
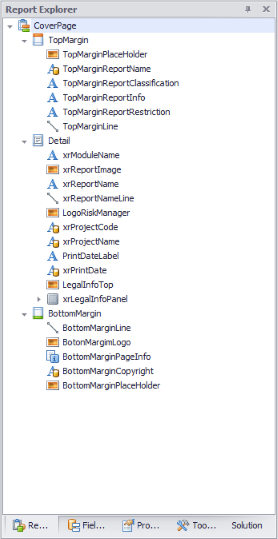
Note that the Report Explorer window displays all the elements on the page being edited in a tree structure. The elements (bands, controls within each band) are shown in vertical order according to the order in which they appear in the report. The Report Explorer window below shows that this page in particular has three bands: TopMargin, Detail, and Bottom Margin (see figure below). While these bands contain elements, such as labels and pictures, for templates provided by Modulo, they will not contain any elements for generic templates created from scratch. The elements included in each band will appear as you include them in the template.
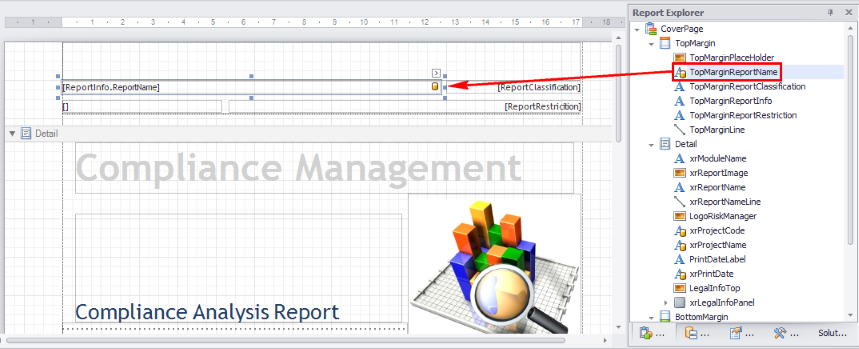
In addition to allowing you to clearly view the structure of the elements on a page, when an element is selected in the Report Explorer window, the element selected is shown highlighted in the editing area, allowing its properties to be edited. For example, when the TopMarginReportName control from the TopMargin band is clicked in Report Explorer, this element is highlighted on the page.
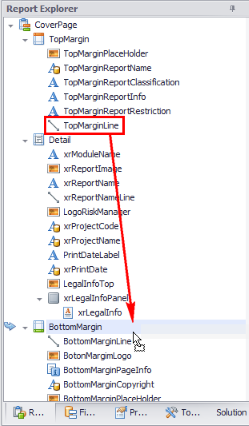
Another interesting feature from the Report Explorer window is that it allows applicable controls to be dragged and dropped from one band to another. The figure below shows the TopMarginLine control from the TopMargin band being dragged to the BottomMargin band.
All report templates exported from the system are linked to one or more tables in the system database or in an external database. When a report is generated, certain information can be completed dynamically through queries to the database, complementing the static text entered manually in the various pages. These queries are executed every time the report is generated to ensure updated results.
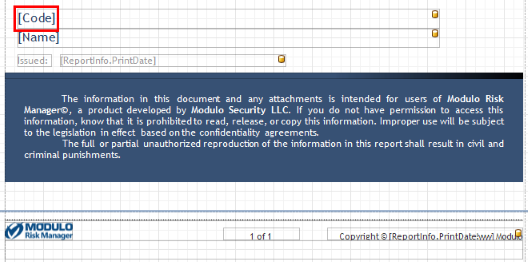
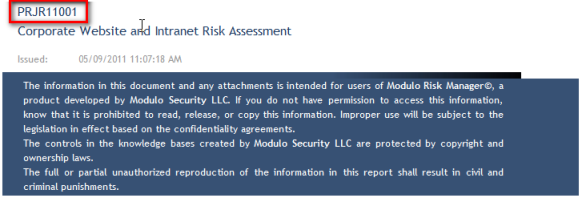
In the above example, the Detail band of the report contains a control (Code) which will show the project code whose results are being displayed. This content is dynamic and will be obtained through the [Code] column.
When a report is generated, the project code will be obtained through a table and displayed in the place of the column.
In addition to a data source specified for the report as a
whole, each control that uses columns or calculated fields also must be linked
to a data field. If there are controls linked to data sources in a report band,
they will be indicated in the Report Explorer window through an
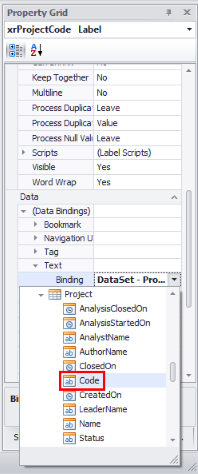
icon: . The data source linked to the Code
control can be viewed in the Data Bindings group in the Property Grid
window.
. The data source linked to the Code
control can be viewed in the Data Bindings group in the Property Grid
window.
In short, each template uses a number of pre-defined queries
to obtain values that are displayed in the reports when these are generated.
Queries are identified by an icon ( ), and columns that contain values
obtained by the queries that constitute the tables are identified by a second
icon (
), and columns that contain values
obtained by the queries that constitute the tables are identified by a second
icon ( ). In the example shown in the figure
above, "Project" is the name of a query to the database, and this query, when
run, returns values for the AnalysisClosedOn, AnalysisStartedOn, AnalystName,
AuthorName, ClosedOn, Code, CreatedOn, LeaderName, Name, Status,
SubstituteLeaderName, TotalIdentifiedRisk, and TotalNumberofAssets columns.
). In the example shown in the figure
above, "Project" is the name of a query to the database, and this query, when
run, returns values for the AnalysisClosedOn, AnalysisStartedOn, AnalystName,
AuthorName, ClosedOn, Code, CreatedOn, LeaderName, Name, Status,
SubstituteLeaderName, TotalIdentifiedRisk, and TotalNumberofAssets columns.
In the Report Explorer window, when the mouse cursor is placed over a control that is linked to a data source, a tooltip appears with information on this association. In the figure below, we can see that the PrintDate control located in the Detail band is linked to the PrintDate column, whose value is obtained through a query named ReportInfo.
To indicate queries and their columns, the editor uses the following notation: [QueryName.ColumnName]. In the example below, we then have: [ReportInfo.PrintDate].
In more complex reports a number of different tables can be used, returning hundreds of columns. Report Designer provides the Field List window that displays the full list with all the tables the report uses, discussed ahead.