This section explains how to generate risk reports in the analysis phase of a risk management project.
Reports generated by the system present a consolidated view of information on the risks identified during the analysis. They are essential for monitoring the evolution of the organization’s risk indices, which then makes them a fundamental part of a solid risk management process.
Each of these reports can be customized according to your organization’s needs and enabled for use. Note that it is possible to disable all report templates, both custom and those provided by Modulo, in which case no reports will be available in this section. For details on managing report templates and editing them, see Chapter 5: Risk -> Risk Reports -> How to Manage Risk Report Templates.
You can also schedule a report to be sent by specifying the recipients, the date on which they will begin to be sent, the frequency with which they will be sent, and the number of times. For example, if you want to receive a weekly report on the risks in your IT network, you can schedule a report that is filtered to include only analysis information related to your network. A daily time must be set in the Administration module for these reports to be sent. For details on how to set this time, see Chapter 17: Administration -> Scheduled Reports.
There are four types of risk reports provided by the system: the Risk Analysis Report, Detailed Risk Report, the Detailed Risk Report by Threat, and the Executive Risk Report. Filters can be set before generating the report to decide what will be displayed in the results. This section presents an overview on these reports to help you select the most appropriate template.
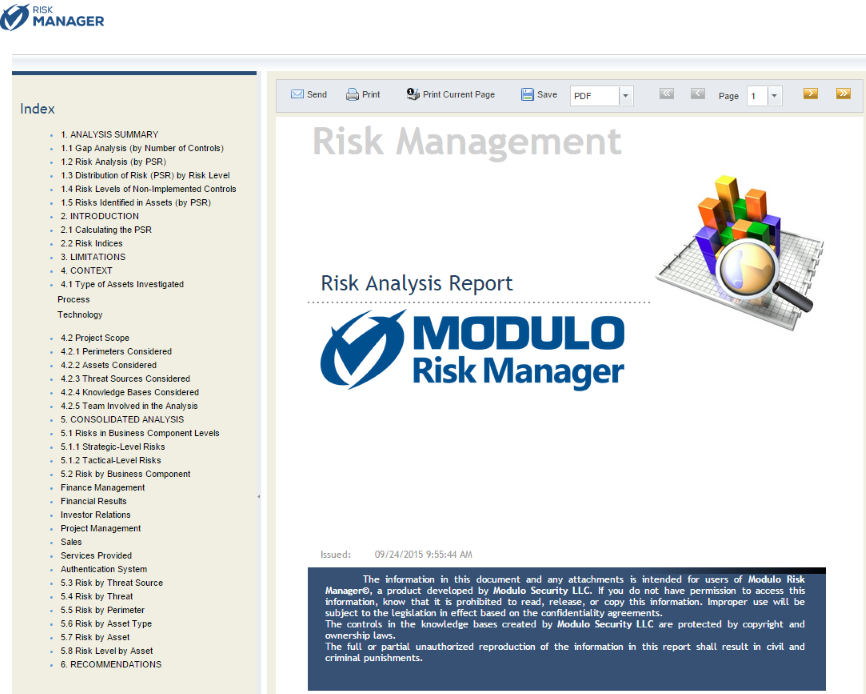
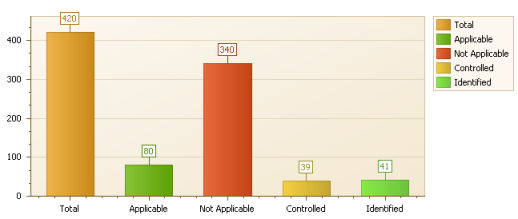
•Risk Analysis Report: Presents consolidated risk results from the analysis phase, based only on the closed questionnaires. It should be used to guide the decision-making process on which actions should be taken to reduce the risk levels in the organization (see figure below).
This report contains six sections, namely: Analysis Summary, Introduction, Limitations, Context, Consolidated Analysis, and Recommendations.
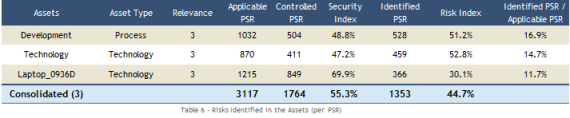
Using charts and tables, the Analysis Summary section presents the results of the risk analysis. The information contained in this section includes: number of controls by status, PSR by status of the analyzed risks, risk distribution by risk level, risk levels of the non-implemented controls, and risks identified in the assets.
The Introduction explains what the risk indices are (PSR, Risk Index, Security Index, Control Index, and Gap Index) and how they are calculated.
The Limitations section explains the reach of the results contained in the report, which are essentially based on the knowledge bases used for the project.
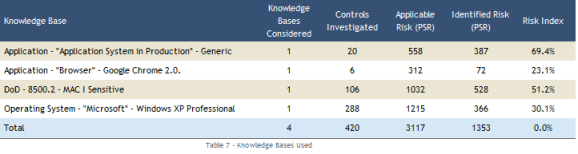
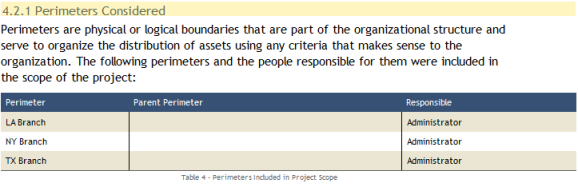
The Context section presents the types of assets investigated and the scope of the risk analysis (perimeters, assets, and threat sources considered; knowledge bases used; and the team involved in the analysis). See the figures below for examples of tables found in this section.
Using tables, the Consolidated Analysis presents the consolidated risks for the main business components. Next, the risks for each of the components are presented. Lastly, risks are presented by threat source, threat, asset type, asset, and risk level by asset. Thus, the risks are presented in different perspectives, supporting the decision-making process for the upcoming evaluation and treatment phases of the project.
The Recommendations section presents the actions to be taken in order to lend continuity to the risk management project.
•Executive Analysis Report: The Executive Analysis Report (EAR) presents a summarized version of the risk analysis results for the project (see figure below).
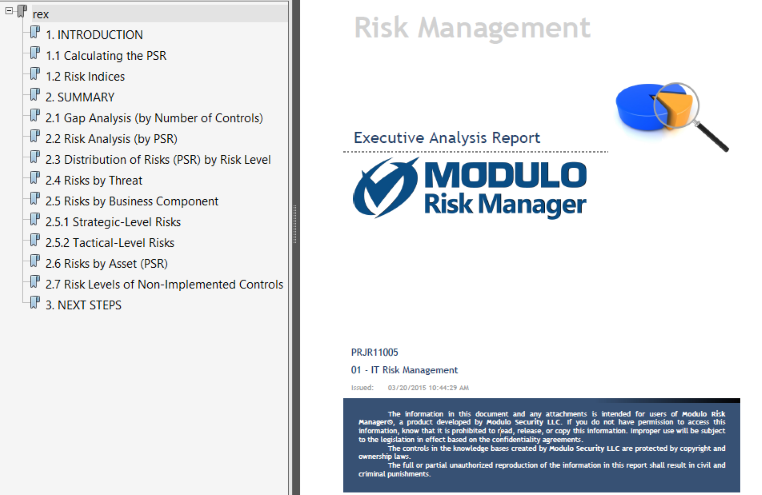
This report contains three sections, namely: Introduction, Summary, and Next Steps.
The Introduction presents the contents of the report and explains what the PSR is, how it is calculated, and what the risk indices are (PSR, Risk Index, Security Index, Control Index, and Gap Index).
Using charts and tables, the Summary presents the results of the risk analysis. The information contained in this section includes: number of controls by status, PSR by status of the analyzed risks, distribution of risks by levels, risks by threat and by business component, risks at strategic and operational levels, risks found in assets, and risk levels of the non-implemented controls (see figures below for examples of tables found in this section).
The Next Steps section presents the steps to be taken to lend continuity to the risk management project, which supports the decision-making process on which risks to treat according to your organization’s objectives.
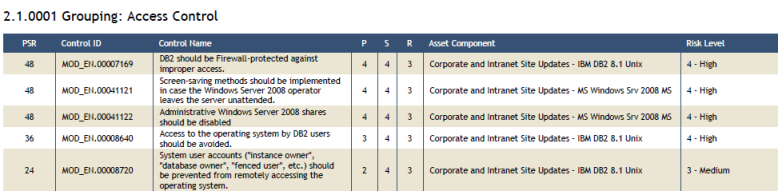
•Detailed Risk Report: The Detailed Risk Report orients managers on how to prioritize the recommendations to be applied according to the risk level. This report should also be used as an instrument to implement controls in the assets analyzed (see figure below).
This report presents two tables to support the process for prioritizing risk treatments: List of Non-Implemented Controls and Detailed List of Non-Implemented Controls (see figures below for examples of tables found in this section).
The first contains information on the controls that should be implemented, their priority, and the asset component to which the non-implemented control refers. The table is ordered by grouping and, within the groupings, by the PSR of each control in descending order.
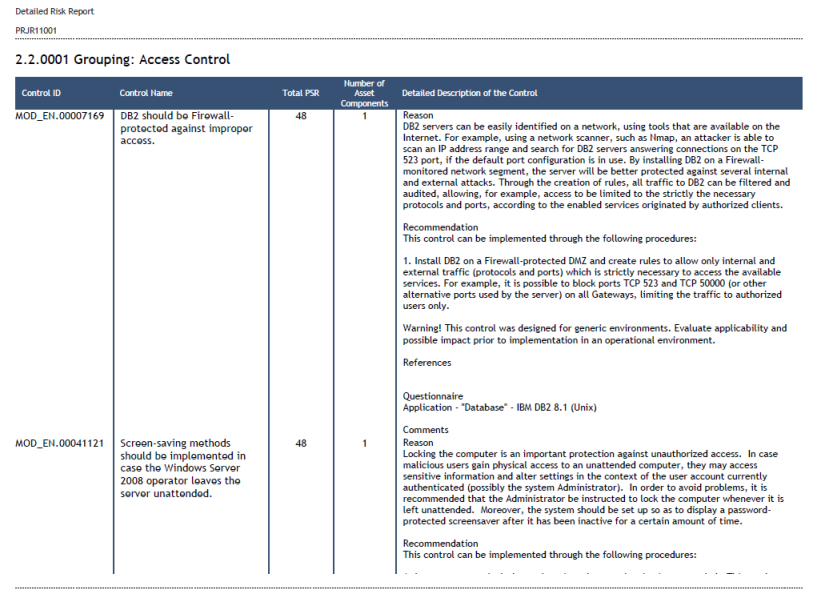
The second table contains information on which controls should be implemented, the sum of the total risk for the asset components according to the non-implemented controls (PSR total), the number of asset components for which controls will be implemented, the justification for each control, and the recommendation on how to implement each control (see figure below).
In addition, any image in BMP, JPEG, PNG, or GIF format that was attached as evidence for the answer to a control (either by the analyst or by interviewees and reviewers) can be displayed. Files in other formats are also listed and can be accessed through their respective links. Note that the user must be authenticated in the system and connected to the internet to be able to access this content through the PDF version of a report. Also available for use in this report template are data sources providing information on the implemented controls, including evidence and comments provided by analysts and during interviews.
•Detailed Risk Report by Threat: Orients managers on how to prioritize the recommendations to be applied according to the risk level. This report should also be used as an instrument to manage threats that may affect the progress of the organization’s activities (see figure below).
This report presents two tables to support the process for prioritizing risk treatments: List of Non-Implemented Controls by Threat and Detailed List of Non-Implemented Controls by Threat (see figures below for examples of tables found in this section).
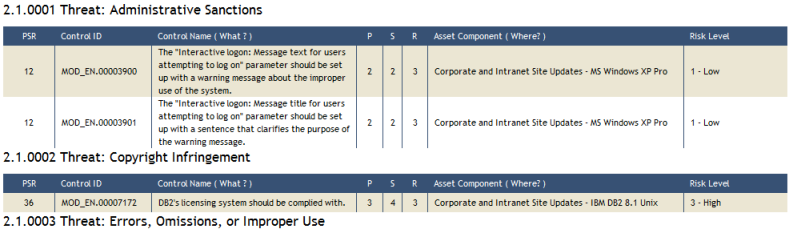
The first lists all controls analyzed in the latest closed questionnaires related to the assets in the scope of the report, grouped by threat and ordered by descending level of risk (PSR).
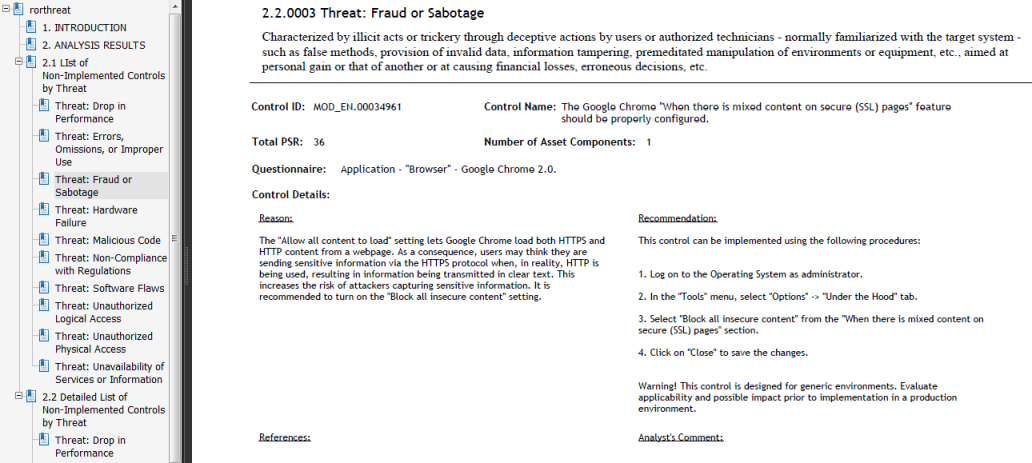
The second table, also grouped by threat, contains more detailed information on which controls should be implemented, namely: the sum of the total risk related to the asset components, according to the non-implemented controls (total PSR); the justification for each control; the recommendation on how to implement each control; and the number of asset components that will have implemented controls (see figure below).
In addition, any image in BMP, JPEG, PNG, or GIF format that was attached as evidence for the answer to a control (either by the analyst or by interviewees and reviewers) can be displayed. Files in other formats are also listed and can be accessed through their respective links. Note that the user must be authenticated in the system and connected to the internet to be able to access this content through the PDF version of a report. Also available for use in this report template are data sources providing information on the implemented controls, including evidence and comments provided by analysts and during interviews.
Note: Reports are best viewed in PDF format.