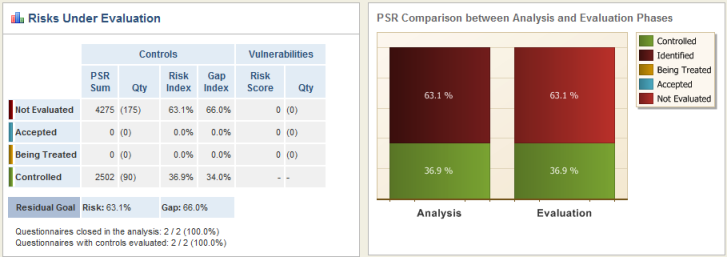
In the evaluation phase, you can accept risks that do not have a large impact on the organization, as well as create new events so that unacceptable risks can be sent to treatment or associate them with existing open treatment events, instead of creating new ones. To better conduct the evaluation process, it is important to understand the indicators and graphs displayed in this phase of the project. Before accepting or sending any risk to treatment, the comparative table and graph from the evaluation phase display results only for the risks that have not been evaluated or those that are already controlled (see figure below).
In the case of the figure above, the Risk Index of the risks that have not been evaluated is 63.1% and the corresponding Gap Index is 66.0%. The Risk Index of the controlled risks is 36.9% and the Gap Index is 34.0%. The information related to controlled risks does not change, since it refers to implemented controls.
As risks are accepted, information referring to the accepted risks begins to appear (see figure below).
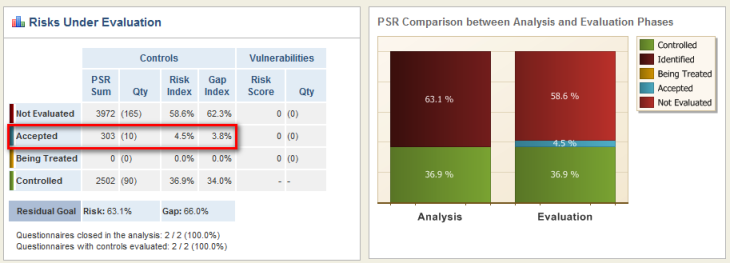
As shown in the figure above, after 10 risks were accepted, the Risk Index of the accepted risks went from 0% to 4.5%, and the Gap Index went from 0% to 3.8%.
In addition to accepting risks, you can send them to treatment. In this case, the information on the risks undergoing treatment will also increase (see figure below).
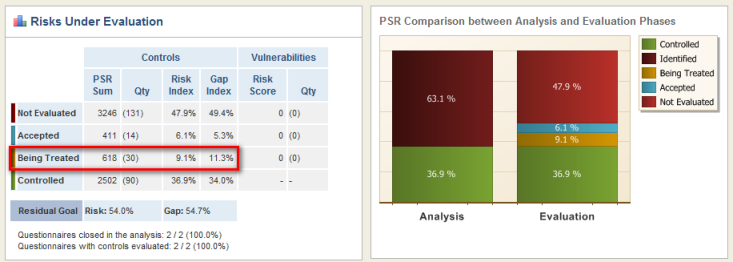
As shown in the figure above, after 30 risks were sent to treatment, the Risk Index of the risks undergoing treatment increases from 0% to 9.1%, while the Gap Index increases from 0% to 11.3%.
Note that as risks are accepted or sent to treatment, the 175 risks that initially were not evaluated now total 131, and their Risk Index and Gap Index percentages also went down (see figure above).
Note: Risks arising from non-implemented controls or vulnerabilities that are "Sent to Treatment" in projects are displayed as "Being Treated" in these graphs. Vulnerability-related risks that are "Treated" are also displayed as "Being Treated" in the graphs, while "Treated" risks from controls are not displayed in them.