This section explains how to view statistics on closed calls and occurrences by category through the Today’s Occurrences section. This section can only be accessed by users with permission to the Manage Dispatch Requests privilege or those assigned to the Dispatcher role.
Only calls and occurrences that were completed in the current date are displayed in the list that sorts calls and occurrences by category. The list is reset at midnight, meaning that these statistics are cleared each day. However, the window and map also display the open occurrences with and without assigned service units, which are not cleared at the end of the day. You may also view information on occurrences with assigned service units compiled into a list in the Unfinished Occurrences section and view information on occurrences without service units in the Priority Occurrences section. Calls and occurrences from all dispatch groups will be available here, regardless of whether you were included in a group.
Here you can also filter the list of statistics on calls and occurrences by an associated event, as registered during call creation. The filter for associated events only filters the list by category, and not the occurrences displayed on the map .
This feature is enabled by default. However, note that for this section to be available, the EnableIntegratorIncidentsSummaryWindow element must be set to "true" in the appSettings parameter of the web.config file for the application, as in the example below.
<add key="EnableIntegratorIncidentsSummaryWindow" value="true" />
1. Access the Dispatch module.
2. Select Manage Calls, Manage Dispatches, or Monitoring to access the map.
3. Select Today’s Occurrences from the Dispatch menu.
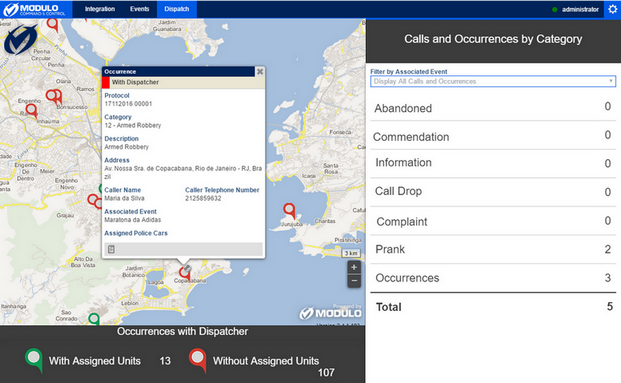
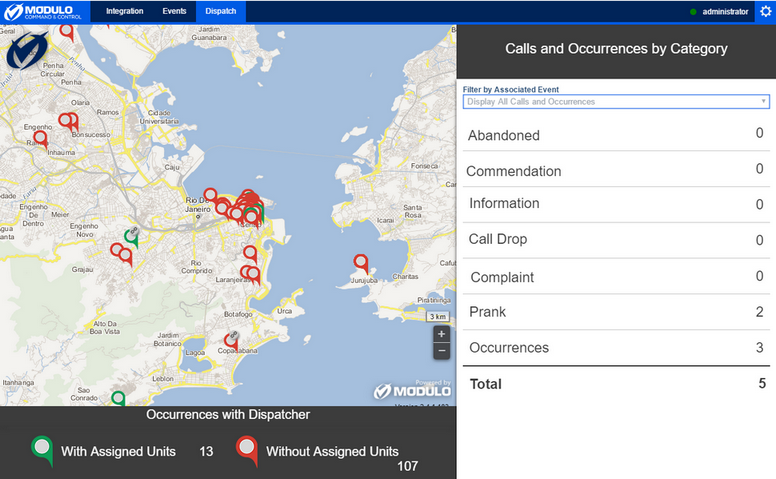
The system displays the Dispatch map with a window containing statistics on the calls and occurrences of the day (see figure below). All open occurrences for which a dispatch was requested are plotted on the map.
In the Calls and Occurrences by Category window, you can view the number of calls and occurrences that were completed on the current date - separated by category - and filter them by their associated event. The categories that appear can be changed by contacting your system administrator. Also displayed at the bottom are the number of open occurrences with and without associated service units. The color of the pin on the map indicates whether the occurrence is associated with service units (green) or not (red).
4. In the Filter by Associated Event field, select an associated event to filter the list of calls and occurrences by category. When selecting an event, if a logo has been configured in the Associated Events section of this solution, it will be displayed in the upper left corner of the page.
5. Click a pin on the map to view details on the occurrence (see figure below).