1. Access the Risk module.
2. In the Risk Management Projects section, click the List Projects option.
3. In the Risk Management Projects section, click Edit next to the project whose list of risk treatment events you want to view.
4. Click the Treatment tab.
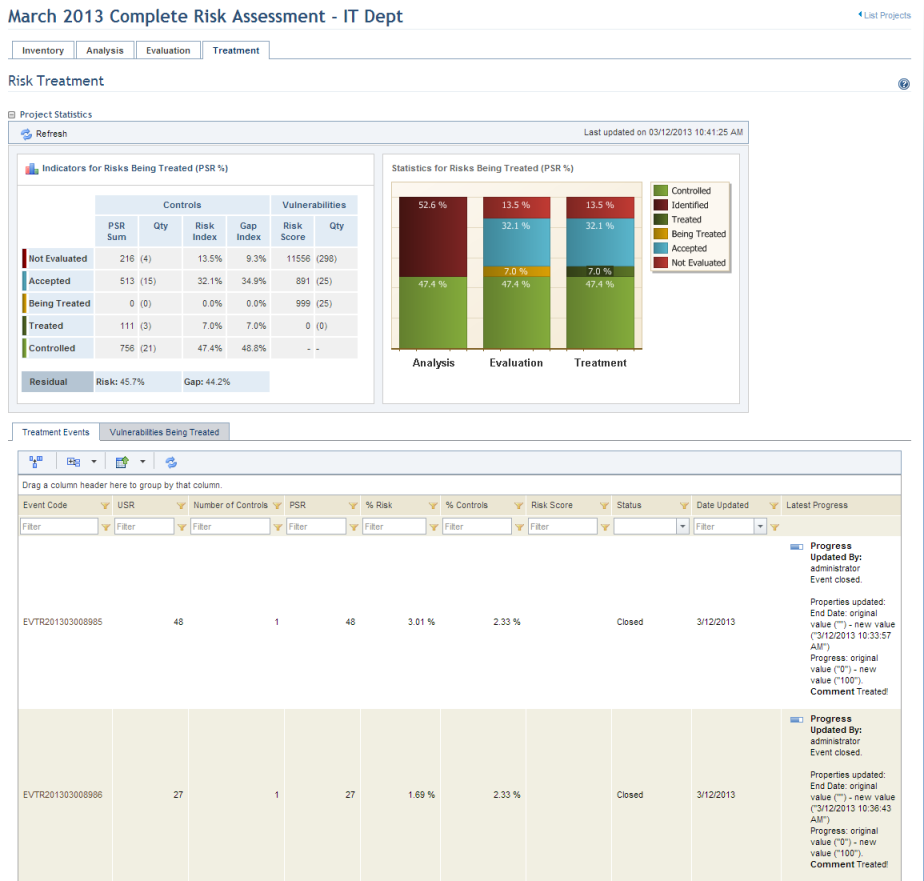
The system displays statistics on the risks identified in the project as well as two tabs (see figure below). By default the Treatment Events tab is displayed, listing all the events generated to treat both non-implemented controls and vulnerabilities.
Note 1: The graphs displaying statistics are not updated automatically by the system. To view the most recent information after any changes take place in the project, click Refresh in the upper left corner. The latest information will then be displayed. These can be hidden by clicking the name of the graph or by configuring your preferences in the Home module.
Note 2: A number of columns are included in the Treatment Events tab to help you filter through events and easily locate the one you are looking for:
•Event Code: unique identification code for events generated automatically by the system. The content of this column is displayed as a link through which the event can be accessed.
•Title: name of the risk treatment event.
•U: urgency score of the event.
•S: severity score of the event.
•R: relevance score of the event.
•USR: indicates the USR score for the event, which measures the priority with which the event should be treated and is calculated by multiplying the urgency x severity x relevance.
•Risk Score: displays the sum of each Risk Score calculated for each vulnerability the event is treating.
•Subtype: indicates whether the event was created to treat vulnerabilities or non-implemented controls.
•Number of Controls: indicates the number of non-implemented controls being treated by a single event.
•Number of Vulnerabilities: indicates the number of vulnerabilities being treated by a single event.
•PSR: indicates the PSR sum for the non-implemented controls being treated by the event.
•% Risk: indicates the percentage of risk the event is treating compared to the total risk identified in the analysis.
•% Controls: indicates the percentage of non-implemented controls the event is treating compared to the total non-implemented controls identified in the analysis.
•Status: indicates the status of the event (Open, Cancelled, Closed).
•Date Updated: displays the date on which the treatment event was last updated in the Workflow module.
•Latest Progress: shows the comment entered when the event was last updated, as well as who updated it.
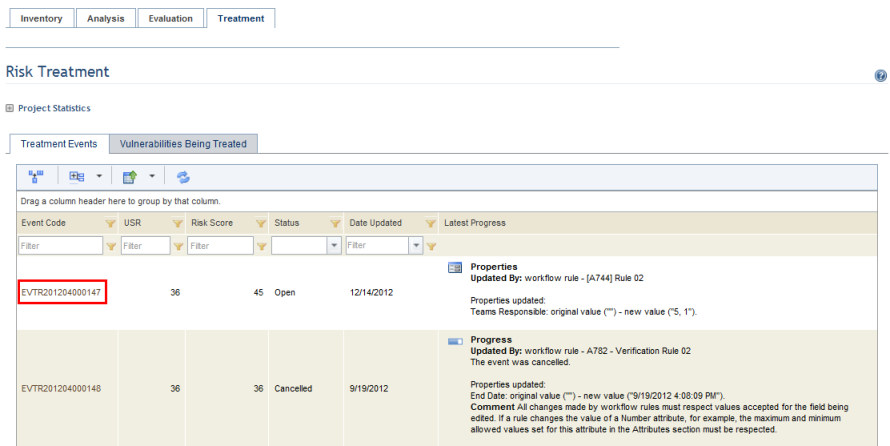
5. Click the event code to view the treatment event (see figure below).
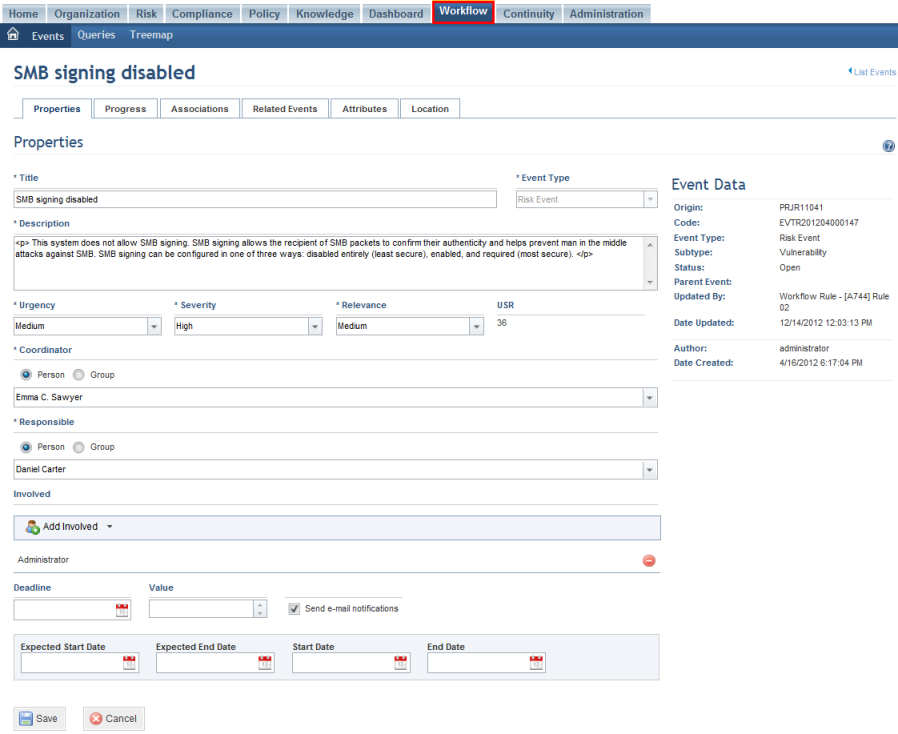
The system opens the event in the Workflow module (see figure below).
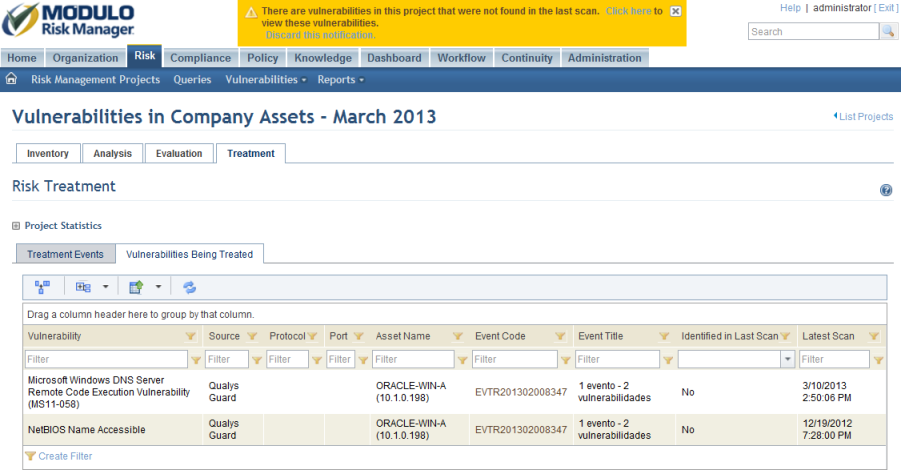
6. In the project, click the Vulnerabilities Being Treated tab to view the list of vulnerabilities for which treatment events were created (see figure below).
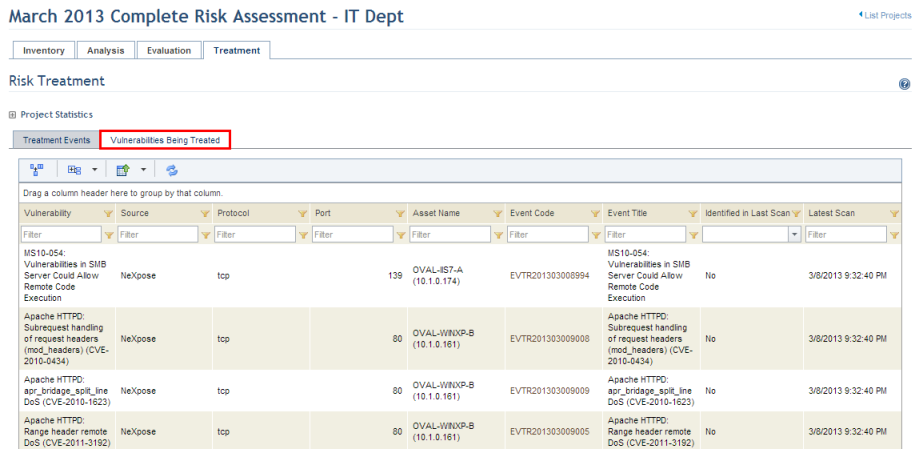
The system displays the list of vulnerabilities that were sent to treatment through the project.
Note: The Identified in Last Scan column indicates whether the vulnerabilities for which treatment events were generated were found in the latest scan results. You can then decide whether to cancel or close these events. For all vulnerabilities that were not imported through one of the four available integration tasks, this column will display "N/A".