 ) next to the dashboard you want to
view (see figure below).
) next to the dashboard you want to
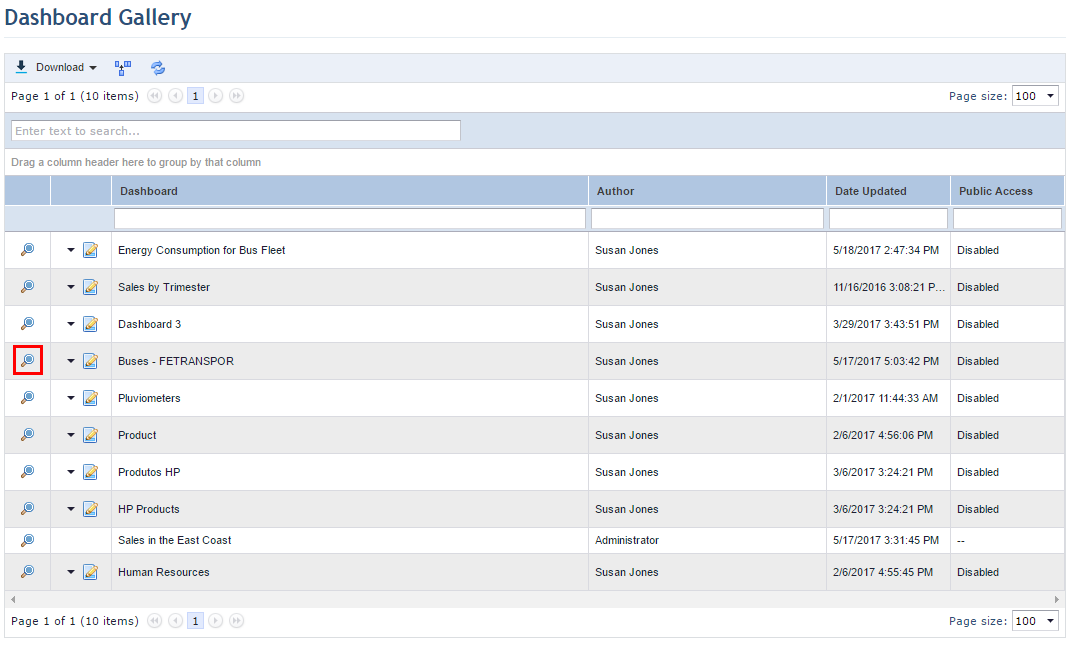
view (see figure below). 1. Access the Data Analytics module.
2.
Select the Dashboard Gallery option and then click View () next to the dashboard you want to
view (see figure below).
The system displays the dashboard selected in a new window (see figure below). In this window you can perform various operations, such as view your dashboards and those you are included in the audience, update data sources, enable automatic updates, change the display theme, export the dashboard to a PDF file, and more.
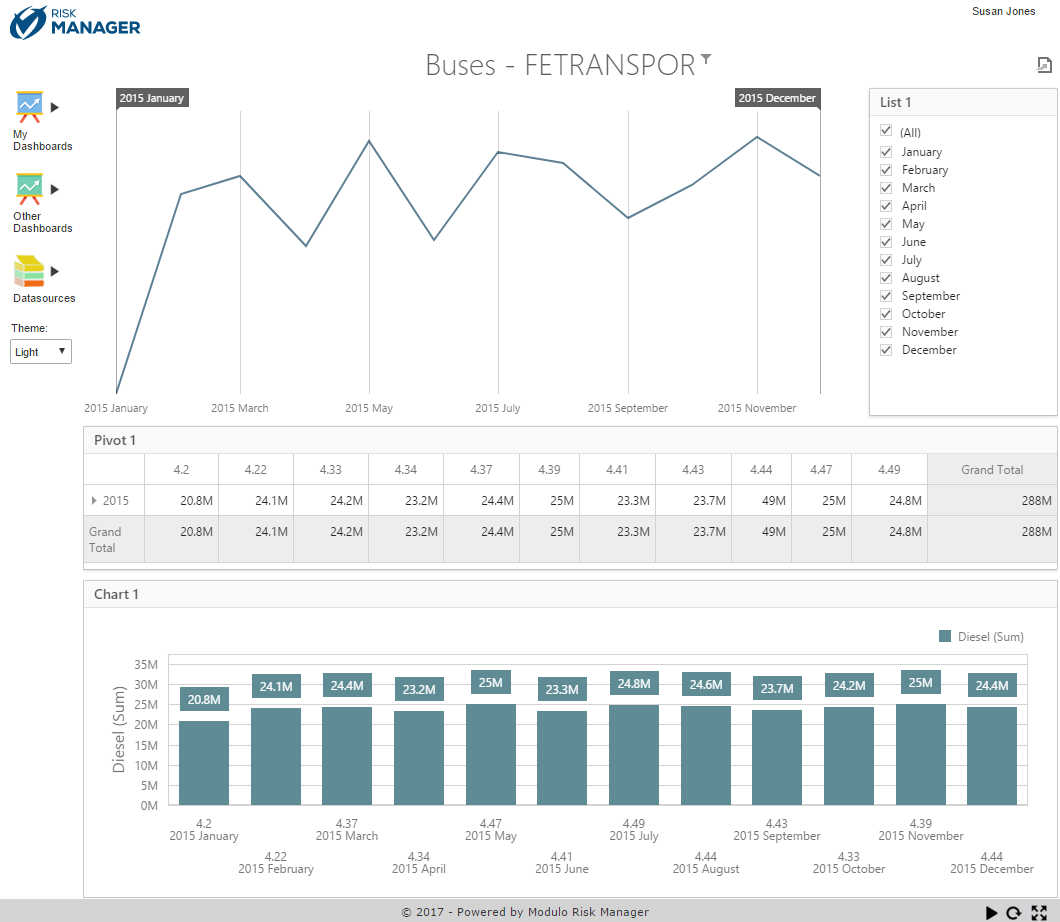
You can interact with various dashboard features: expand a
pivot, drill-down a chart, apply filters, and more. If any filters are applied,
the filter symbol ( ) is displayed next to the dashboard
title. In the dashboard used in the example, a date (month) filter was included.
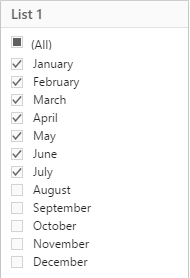
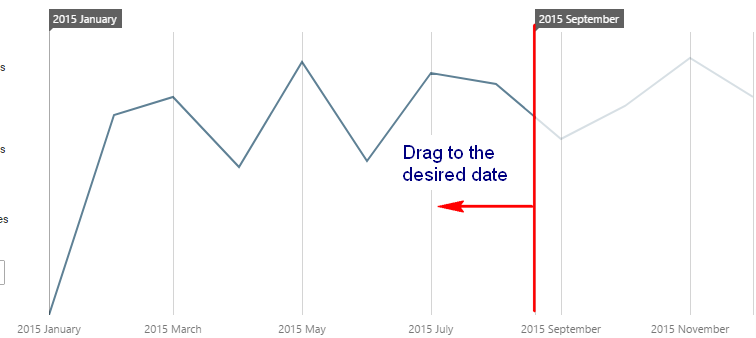
To filter the dashboard so that only the data from January through July are
displayed, you can drag the filter bars to the desired interval or mark only the
checkboxes of the months you want to include in the dashboard (see figure
below).
) is displayed next to the dashboard
title. In the dashboard used in the example, a date (month) filter was included.
To filter the dashboard so that only the data from January through July are
displayed, you can drag the filter bars to the desired interval or mark only the
checkboxes of the months you want to include in the dashboard (see figure
below).
3.
To clear the filters and view all data, mouse over the bottom right corner of
the range filter and click Clear Master Filter ( ).
).
Other tools are available on the left side menu of the dashboard (see figure below).
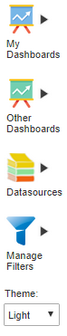
4. Mouse over My Dashboards to view the list of dashboards of which you are the author.
5. Mouse over Other Dashboards to view the list of dashboards of which you included in the audience.
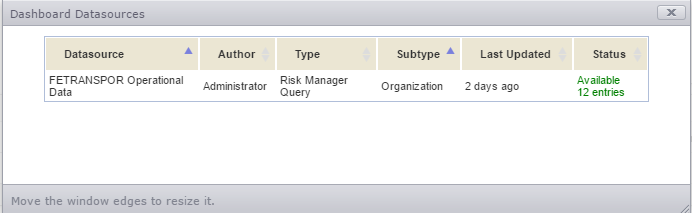
6. Position the cursor over Data Sources and select the List Data Sources option to see the list of data sources used in the dashboard.
The system displays a pop-up window with the list of the data sources of the dashboard (see figure below).
7.
Click Close ( ) to return to the dashboard page.
8.
To view the latest information on the dashboard, position the cursor on
Datasources and select the Update Datasources option. This option
is also available in the lower-right corner of the page on Update
Datasources ( ).
).
Messages are displayed about the progress of the update. The system reloads the dashboard after all data sources are updated.
9. Position the cursor over Datasources and select the Automatic Update option to enable automatic updates for the dashboard.
The system displays a pop-up window where you can define the parameters for the automatic update (see figure below).
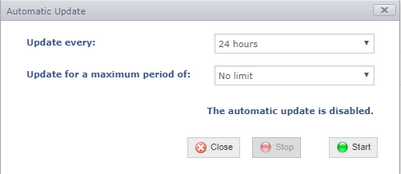
10. In the Update every field, select one of the options from the drop-down list to determine the frequency of the updates.
11. In the Update for a maximum period of field, select the maximum period during which the automatic updates will be enabled. Note that the options available for selection change according to the option selected in the previous field.
12. Once finished, click Start to enable the automatic updates. If you want to quit the operation, click Close.
Messages are displayed showing the progress of the update. The system reloads the dashboard after all data sources are updated.
13. To disable the automatic updates, repeat step 9 and, in the pop-up window that appears, click Stop and then Close.
14. Mouse over Manage Filters to see the filters available in the dashboard. Note that this option will only be displayed if Combo Box or List Box filter elements are applied to the dashboard through Dashboard Designer. Previously saved filters will be displayed as filter options on the list (see figure below).
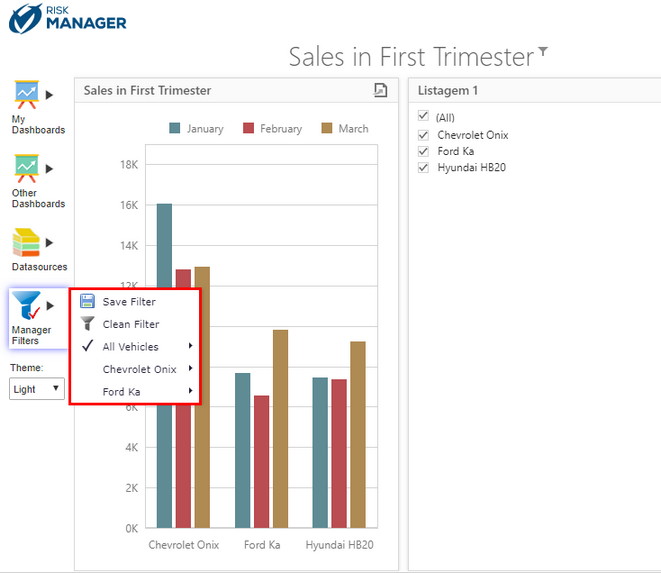
15. To save a new filter, select in the combo box or list the properties you would like to use as filter options in the dashboard and click Save Filter.
The system displays a pop-up window where you can provide a name for the filter (see figure below).
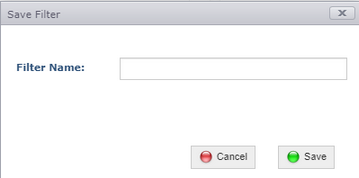
16. In the Filter Name field, enter a name for the filter that will be saved using a maximum of 150 characters and click Save. If you want to quit the operation, click Cancel.
The system displays a success message and applies the saved
filter to the dashboard. A mark is displayed on the Manage Filters ( ) icon to indicate that a filter is
enabled.
) icon to indicate that a filter is
enabled.
Note: Dashboard filters must have unique names. If a new filter is saved with the name of an existing filter in the dashboard, instead of creating a new filter with a duplicate name the system will update the existing filter with the new settings.
17. Mouse over Manage Filters and click Clear Filter to remove the filter applied to the dashboard.
18. Still in Manage Filters, mouse over the name of a filter and click Apply to enable the filter in the dashboard (see figure below).
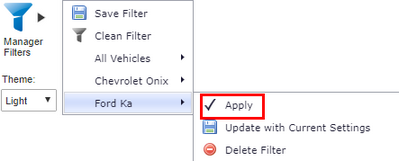
19. To update a filter with a new configuration, first select the new filter elements, then mouse over the filter name and click Update with Current Settings.
The system displays a success message.
20. To delete a filter, in Manage Filters mouse over the filter name and then click Delete Filter on the menu that appears.
The system requests confirmation to delete the selected filter (see figure below).
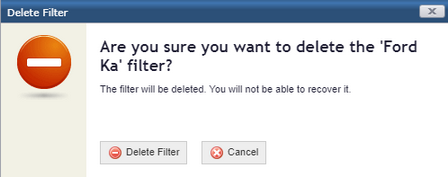
21. Click Delete Filter to confirm. If you want to quit the operation, click Cancel.
The system displays a success message.
22. In the Theme field, select from the drop-down list the theme to be applied on the dashboard.
In the lower-right corner of the
page, other tools are available for the dashboard ( ).
).
23. Click
Update Datasources () to update the data sources and the
layout of the dashboard.
24. Click
Open Expanded Screen ( ) to view the dashboard in full
screen.
) to view the dashboard in full
screen.
25. To quit
full screen, click Exit Expanded Screen ( ).
).