1. Access the Dashboard module.
2. Select List Charts from the Chart Gallery option on the menu.
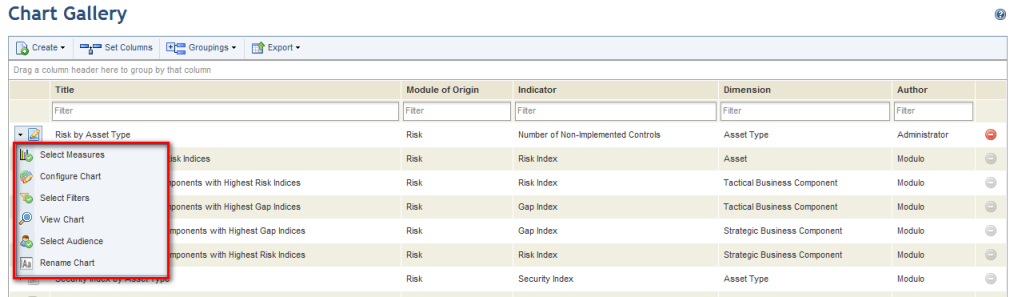
3. In the Chart Gallery section, click Edit next to the chart you want to edit and select an option from the drop-down list (see figure below).
The available options are:
•Select Measures: used to change the measures (indicator, dimension, scope) that comprise a risk, vulnerability, compliance, or workflow chart.
•Customize Query: used to edit the data source, the type of query, and the query itself for custom charts.
•Configure Chart: used to change the type of chart format and its characteristics.
•Select Filters: used to change the data filters used in a risk, vulnerability, compliance, or workflow chart.
•View Chart: used to preview all options selected and a miniature of a risk, vulnerability, compliance, or workflow chart.
•Select Audience: used to change the people and groups authorized to view, with the same permissions as the author, and add the chart to a dashboard.
•Rename Chart: used to change the chart name and description.
4. Make the necessary changes and, when finished, click Publish Chart. If you want to quit the operation, click Cancel.
The system displays a success message.