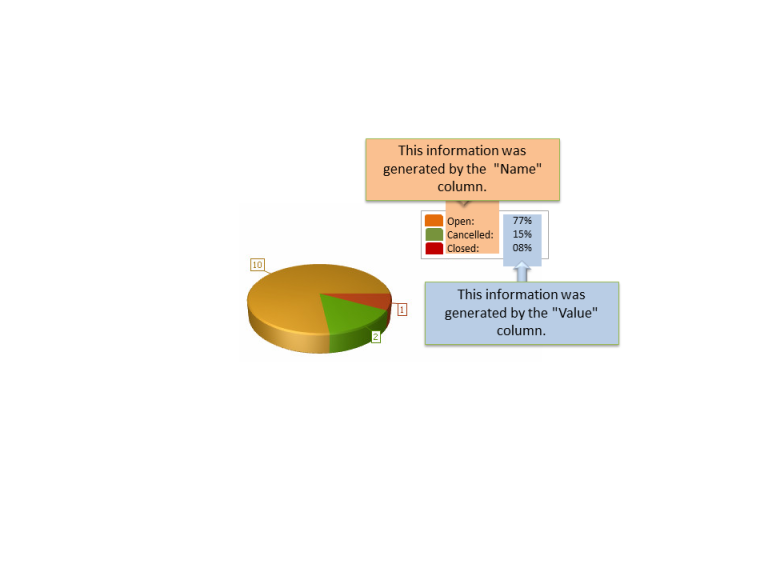
To create customized charts, the tables with "AsTable" at the end of their names can be used, as they have the format needed to generate customized charts. These tables are available in the Field List window and contain two columns: Name and Value. The first column is used to generate the names of the segments in the charts (for example: Very High, High, Medium, Low, Very Low, Open, Closed, etc.). The second column, usually a percentage, is used to define the width or height of the segments of the chart (for example: the width of the pieces in a pie chart or the height of the bars in a bar chart).
In addition to these tables, SQL queries registered in the system through the Manage Templates option in the Reports section of the Organization, Risk or Compliance modules are also available as tables in the Field List window, where they can be used to create customized charts.
1. Open an .mrep file exported through the system and click the Solution window.
2. Double-click the name of the page or band in which you want to include the chart.
3. Click the Tool Box window and drag the Chart control to the report.
4. In the Chart Type step of the wizard that appears, select the type of chart you want to use and the Next.
5. In the Appearance step, select the color scheme you want to use through the Palette option and click Next.
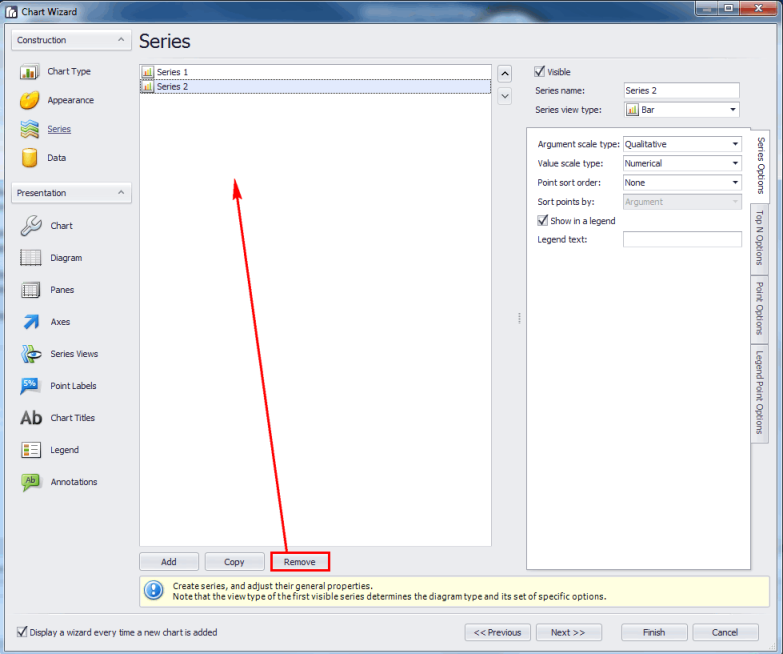
6. In the Series step, select the "Series 2" item and delete it by clicking Remove (see figure below). Note that this will only be possible if the item exists for the type of chart selected.
7. Click Finish to finish editing and exit the wizard.
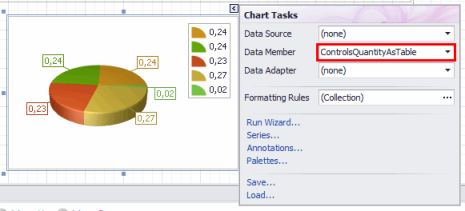
8. Once the new chart has been inserted, click the arrow at the upper right corner of the chart to view the Chart Tasks window.
9. In the Data Member field, enter the name of the table (with "AsTable" at the end) that you want to use as the value of the property. For example, "ControlsQuantityAsTable" (see figure below).
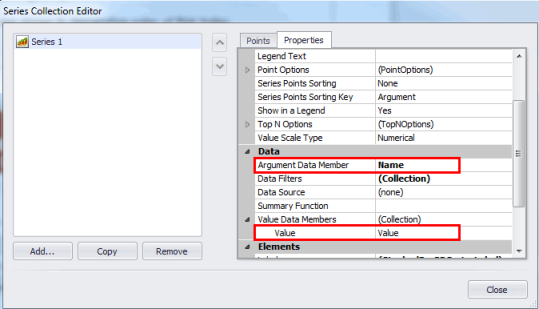
10. Click the Series option to define the information to be displayed in the chart.
11. In the window that appears, click the Properties tab and enter "Name" in the Argument Data Member field.
12. Expand the Value Data Members property and enter "Value" in the Value field (see figures below).
13. When finished, click Close.