1. Click the blank view.
2. In the fields section of the field list, select one of the fields from one of the tables available and drag it to the blank view.
3. You now have a one-column table in the view.
4. In the fields section of the field list, drag a second field to the one-column table.
5. The table now has two columns with a total.
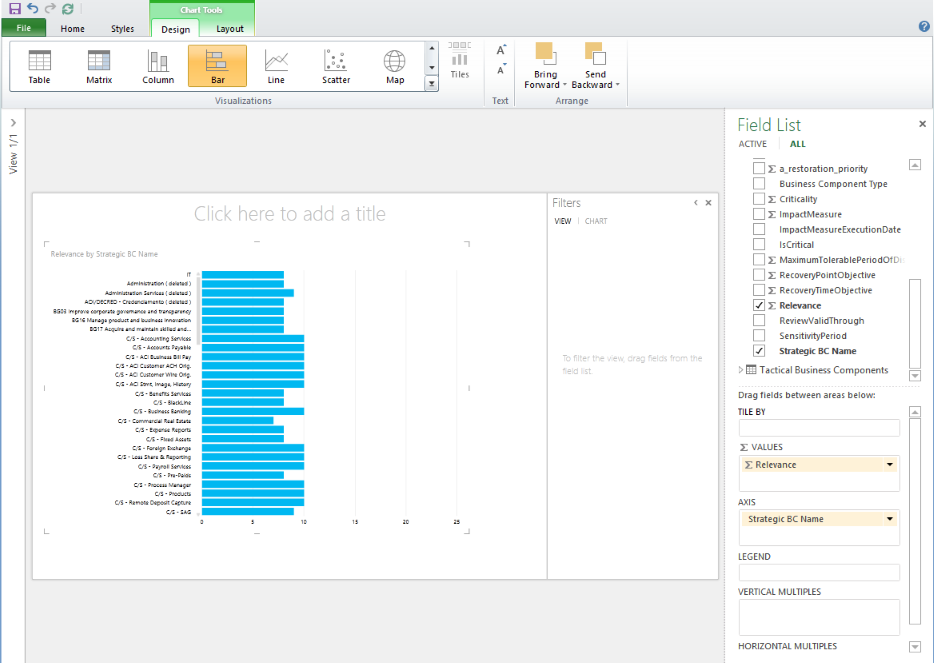
6. In the Visualizations gallery, click the Bar chart. Only the chart options available for the type of data selected will be enabled.
7. Hover over the edge of the chart until the double-headed sizing arrows appear over one of the sizing handles. Drag the sizing handle until you can see all the bars of the chart.
8. Hover over the edge of the chart until the hand icon appears. The hand icon means you can move the chart. Drag the chart to the lower-left corner of the report for now.
You now have a chart similar to the one below.
