1. Access the Workflow module.
2. Select the Treemap option from the menu.
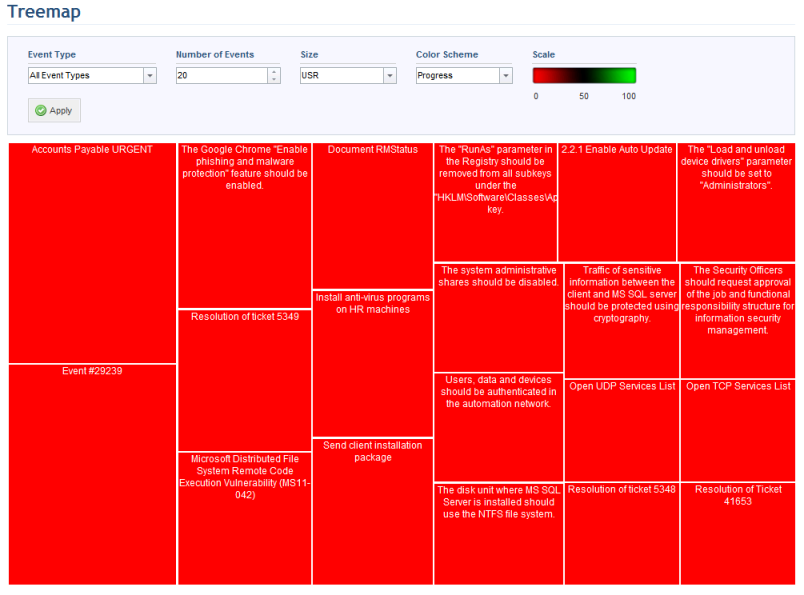
The system displays the treemap with the default configurations (see figure below).
3. In the Event Type field, select an event type to filter the results displayed.
4. In the Number of Events field, select the number of events of the type selected to be displayed. Note that a smaller number should be selected in order for the events to fit comfortably in the map.
5. In the Size field, select the indicator that will determine the size of each box representing events.
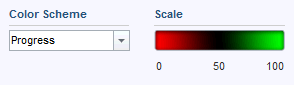
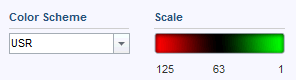
6. In the Color Scheme field, select the indicator that will determine the colors of each box representing events. The scale will vary from red to green according to the indicator selected.
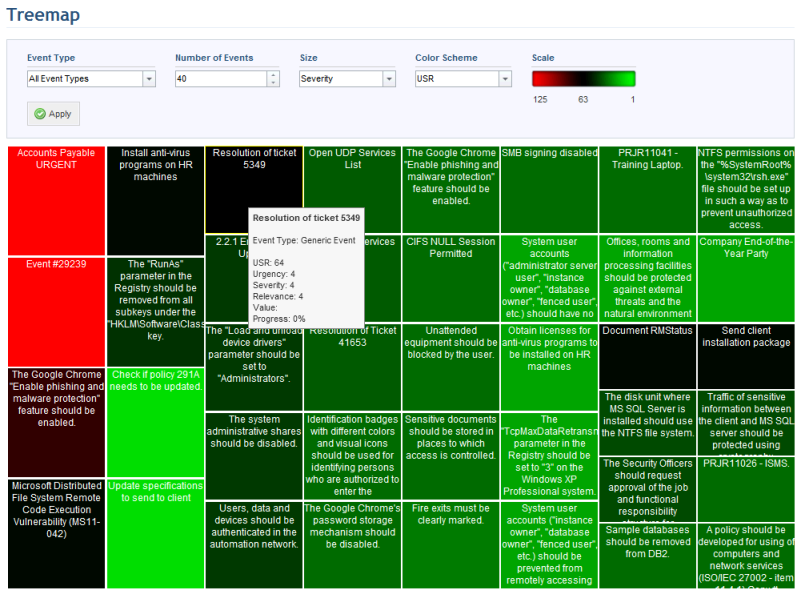
7. Once these options have been configured, click Apply to refresh the treemap.
The system refreshes the treemap according to the configurations selected (see figure below). Note that additional details are displayed on mouse-over, including the event type, USR, urgency, severity, relevance, value, and progress. The event names can be clicked so that you can view the properties of the corresponding event in the Events section of this module.
Note 1: If the Value option is selected in the Size field, events that do not have a value specified will not be displayed.
Note 2: The scale and colors used will vary according to the indicator selected. However, red will always have a negative connotation and green a positive one. For example, if the event progress is selected for the color scheme, a value nearer 100 will represent something positive. In the case of the USR, a higher value represents something negative. The scale, then, will vary to indicate these differences (see figures below).