1. Access the Intelligence solution.
2. In the Intelligence Reports section, click Generate Intelligence Reports.
The system displays a list of all available intelligence reports to which you have permission.
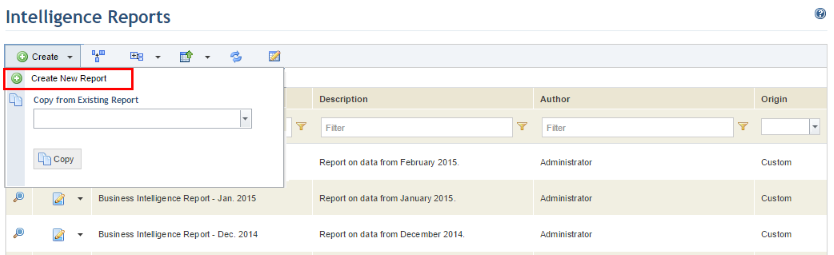
3. To create a report, click Create and select Create New Report (see figure below). If you want to create a report based on a copy, click Create, select the report you want to copy in the Copy from Existing Report field, and click Copy. Keep in mind that only reports of which you are the author or an audience member will be available for selection.
4. In the Name field, enter a name for the report using a maximum of 100 characters.
5. In the Perspective field, select a perspective for the report. All the perspectives to which you have permission will be listed.
Note: If the report was copied and it uses a perspective to which you do not have permission, a new perspective must be selected before the report can be used. You can receive permission to perspectives by being included in their audiences through the Manage Perspectives section of this module, or by being granted the privilege to access perspectives for intelligence reports.
6. In the Description field, provide a description for the report using a maximum of 2,000 characters.
7. When finished, click Save. If you want to save the report and begin editing it, click Save and Edit in Power View. If you want to quit the operation, click Cancel.
If you simply saved the report, the system displays a success message and returns to the main list of reports. If you saved it for editing in Power View, the system loads a blank report in Power View with all the tables available in Microsoft Analysis Services (see figure below). Note that you must have Microsoft Silverlight installed on your machine. For details on installing Microsoft Silverlight, see http://www.microsoft.com/getsilverlight/Get-Started/Install/Default.aspx.
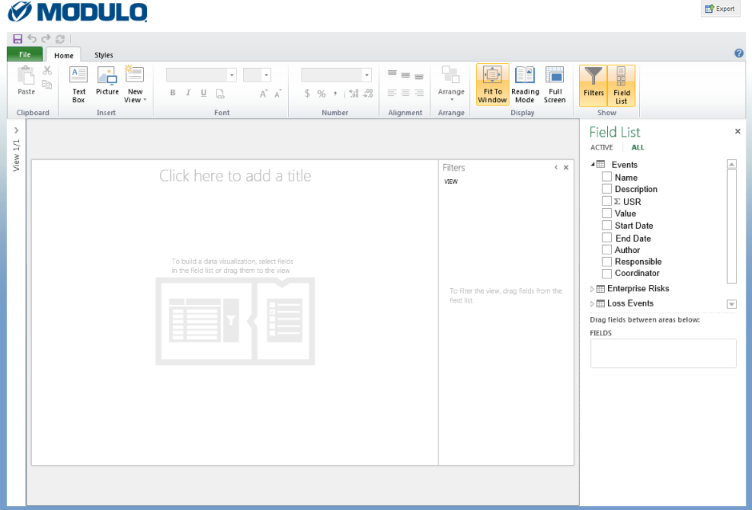
8. Power View opens with the blank view in the center, the ribbon across the top, and the field list on the right. In the fields section of the field list are three tables. To begin with, the tables are collapsed, showing just their names. These tables make up the data model on which the Power View report is based.
9. To expand the tables, click the arrows next to the table names.
10. Now you can see the fields in each table. These may include calculated columns (marked with a Sigma ∑ symbol), measures (marked with a small calculator symbol), and row label fields (marked with a gray and white icon). For more information about calculated fields and measures, see Measure and Non-Measure Fields in Power View. For information about the Power View design environment in general, see Power View Design Experience.