1. Access the Workflow module.
2. Select the Queries option from the menu.
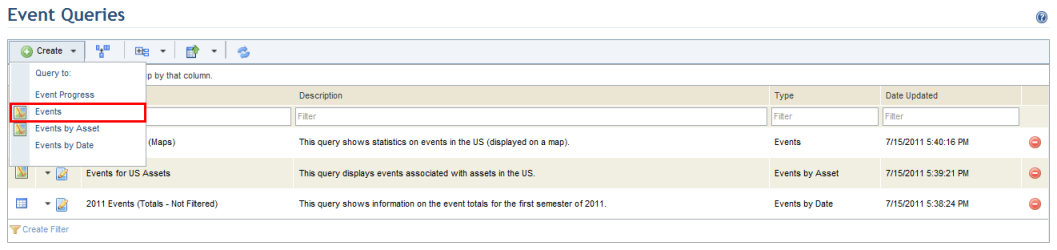
3. In the Event Queries section, click Create and select Events from the drop-down list that appears (see figure below).
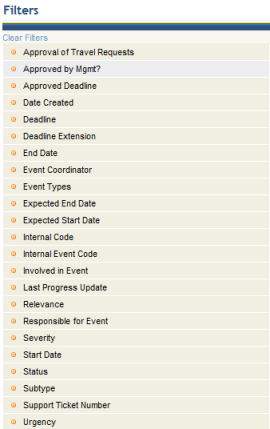
The system displays the Filters step, where the filters to be used can be selected, which will reduce the number of events displayed in the results (see figure below). Event attributes created in the Administration module are listed here as filter options.
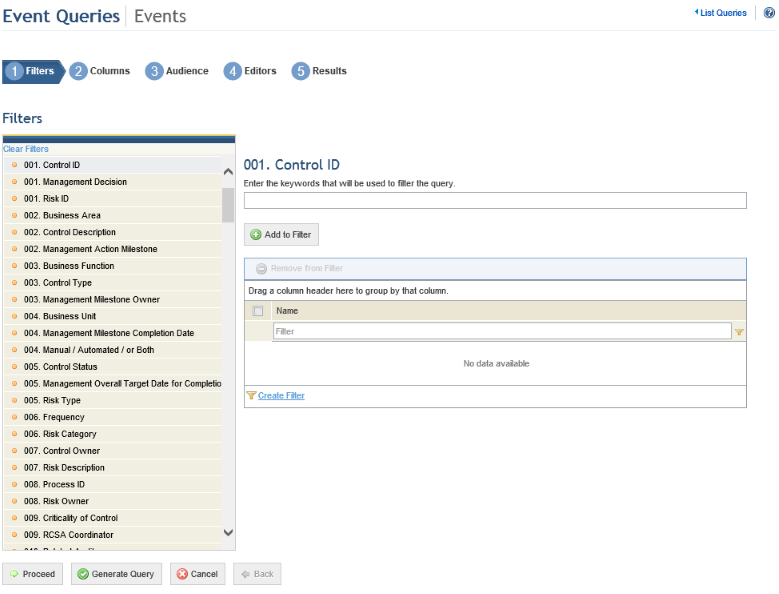
4. Select the filter you want to use by clicking one of the filter options displayed on the left (see figure below). Selecting a filter means indicating that only events that match the criteria set in the filters selected will be displayed in the query results. For example, if you filter a query by a certain status, only the events with the status selected will be included in the results.
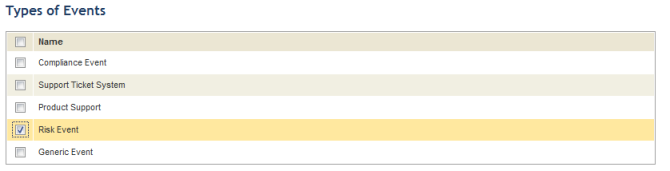
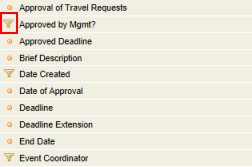
5. Select the criteria to be added to the filter on the list on the left (see figures below for examples). The options will vary according to the type of filter.
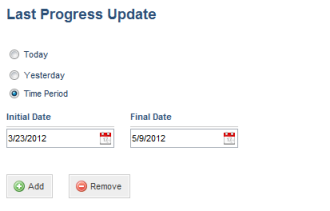
Note When criteria is set for one of the filters
available, a funnel icon ( ) is displayed next to its name (see
figure below).
) is displayed next to its name (see
figure below).
6. After selecting the filters, click Proceed to continue creating the query. If you want to generate the query, click Generate Query. If you want to cancel query creation, click Cancel. To return to the previous step, click Back.
When Proceed is clicked, the system displays the Columns step, where the columns to be displayed in the query results can be selected (see figure below). Event attributes created in the Administration module are available as options here.
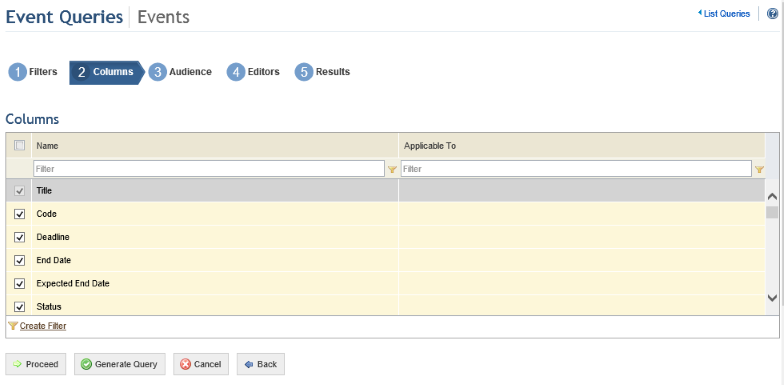
7. Select the columns you want to include in the query results by marking the checkboxes next to each option. By default, the system will show some pre-selected options which can be removed. Only the Title column is required.
8. After selecting the columns, click Proceed to continue creating the query. If you want to generate the query, click Generate Query. If you want to cancel query creation, click Cancel. To return to the previous step, click Back.
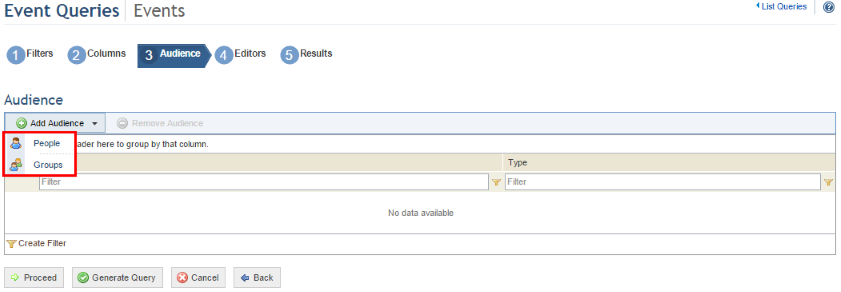
When Proceed is clicked, the system displays the Audience step, where you can select which people and groups will be able to view the query in the Home module and in this module, if they have permission to access it.
9. Click Add Audience and select People or Groups to add them (see figure below).
10. If, for example, you selected People, select the people to be added and click Add People (see figure below).
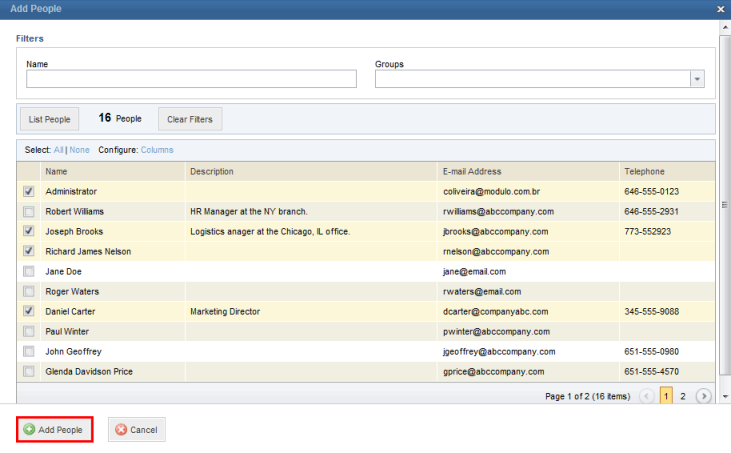
The system displays the people selected.
11. To remove people or groups from the audience, mark the checkboxes next to their names and click Remove Audience.
The system requests confirmation to remove the people or groups from the audience (see figure below).
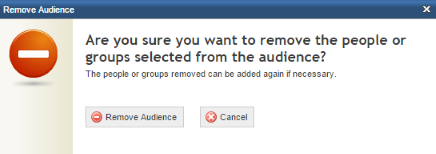
12. Click Remove Audience to confirm. If you want to quit the operation, click Cancel.
The system removes the people selected from the audience.
13. Click Proceed to continue creating the query. If you want to generate the query, click Generate Query. If you want to cancel query creation, click Cancel. To return to the previous step, click Back.
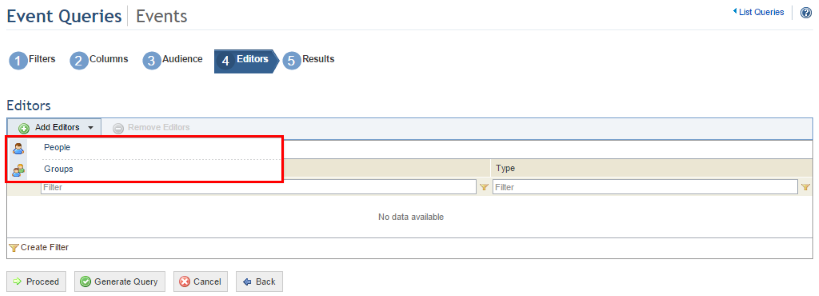
When Proceed is clicked, the system displays the Editors step, where you can select which people and groups will be able to edit the query, receiving the same permissions to it as the author.
14. Click Add Editors and select People or Groups to add them to the list of editors (see figure below).
15. If, for example, you selected People, select the people to be added and click Add People (see figure below).
The system displays the people selected.
16. To remove people or groups from the list of editors, mark the checkboxes next to their names and click Remove Editors.
The system requests confirmation to remove the people or groups from the list of editors (see figure below).
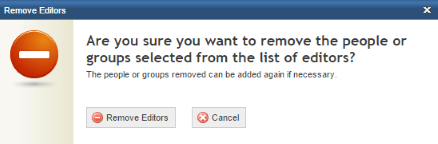
17. Click Remove Editors to confirm. If you want to quit the operation, click Cancel.
The system removes the people selected from the list of editors.
18. Click Proceed or Generate Query to run the query. If you want to cancel query creation, click Cancel. To return to the previous step, click Back.
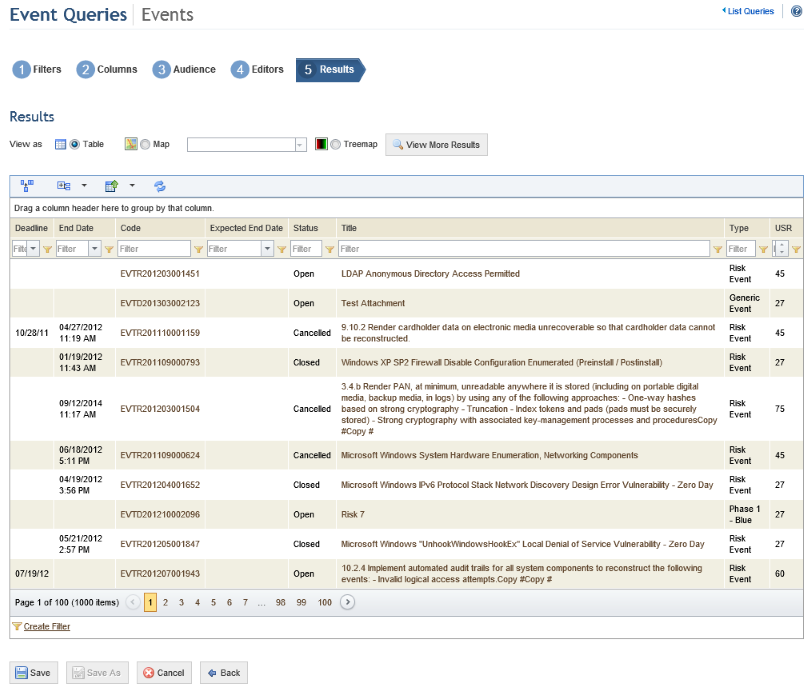
When Proceed or Generate Query is clicked, the system displays the query results (see figure below).
19. Select the Map option to view the query results on a map (see figure below).
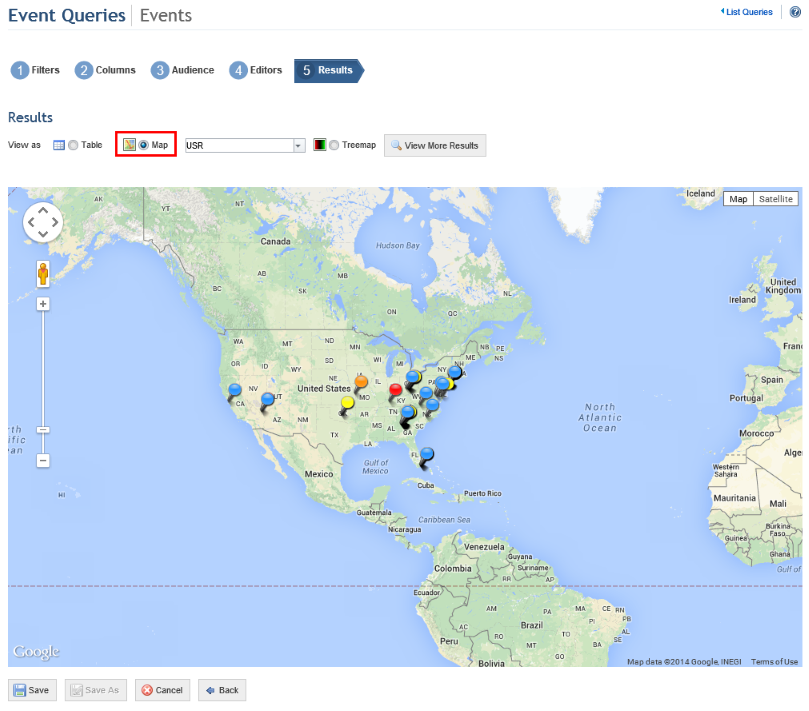
Note: For the results to be displayed on a map, at least one of the events in the scope of the query must have had a location specified for it in the Workflow module, and you must be connected to the internet; otherwise, an alert will be displayed. In addition, for this feature to be available, the option to display maps must be enabled in the Display Options section of the Administration module. The map provider must be preconfigured in the system configuration file (web.config). Keep in mind that some providers require a key or access code that is available only to those who purchase their license. It is the user’s responsibility to acquire it.
The pin colors, which vary according to indicator levels, can also be customized in the Scales section of the Administration module.
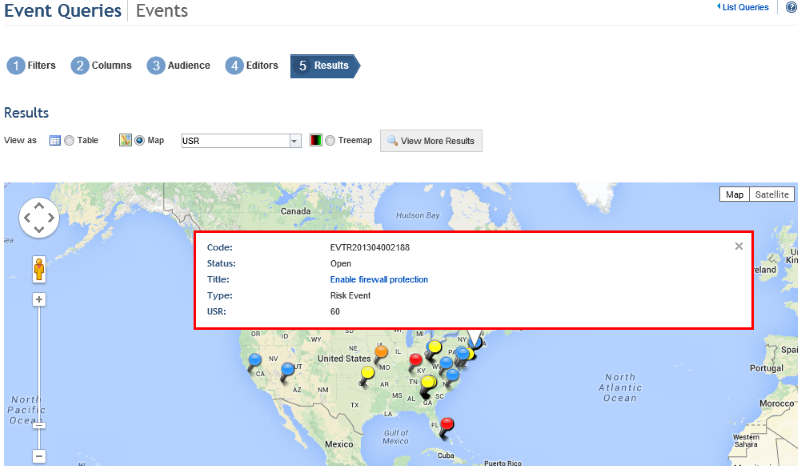
20. Click the pin on the map for the event whose details you want to view.
The system displays a bubble window containing information on the event (see figure below). The fields in the window will correspond to the column options selected previously.
21.
To close the bubble, click Close ( ).
).
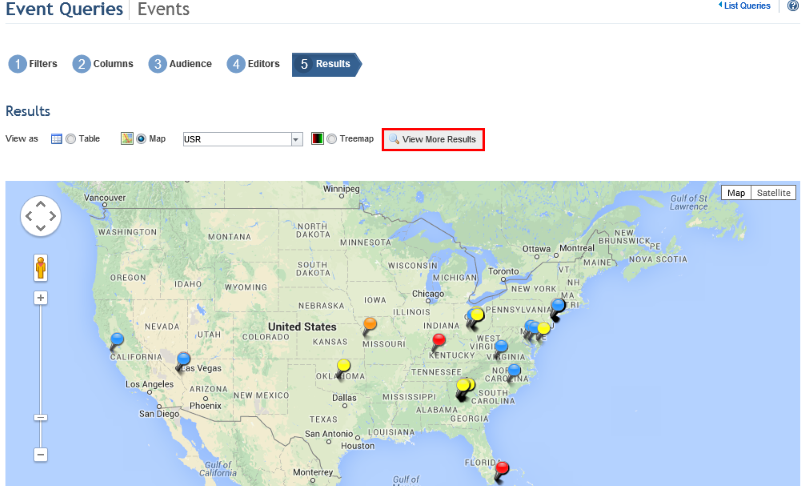
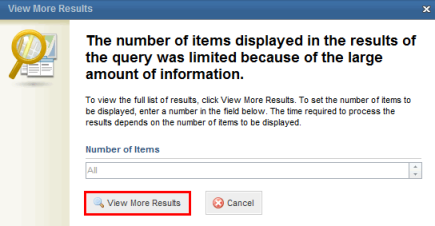
22. When viewing the results on tables and maps, the system will only display 1,000 results at a time, by default, both when creating the query and when it is run. To view more information, click View More Results (see figure below).
23. In the window that appears, enter the number of items you want to view in the results, or leave the field blank to view all possible results. Click View More Results to confirm (see figure below). If you want to quit the operation, click Cancel.
The system displays the additional results, according to the quantity selected.
24. Select Treemap to view the query results through a treemap (see figure below). Details on each event and its relationship with other events will be displayed based on the filters and indicators selected.
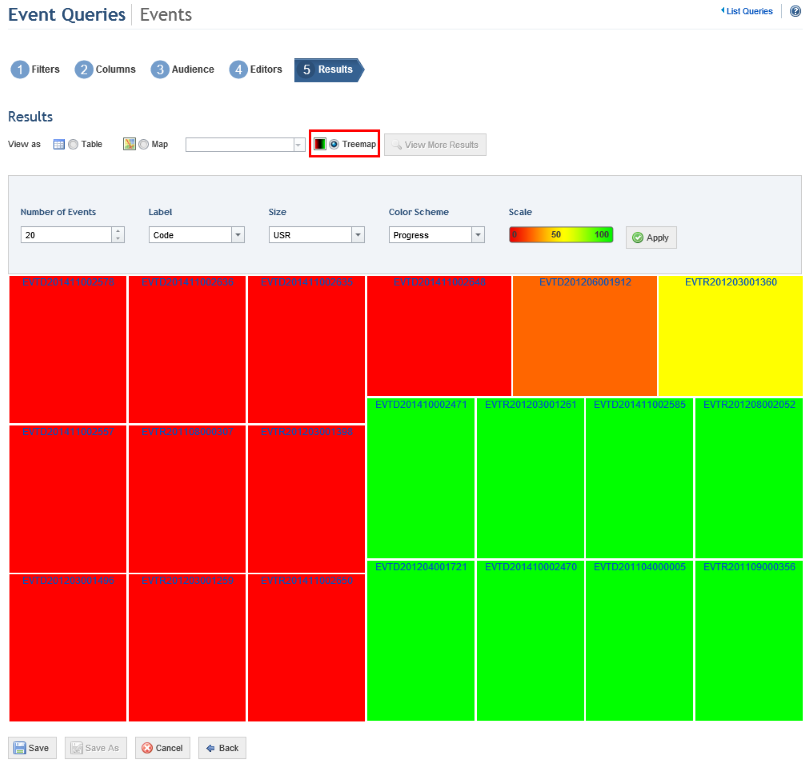
25. When viewing the results on a treemap, the system will only display 20 results at a time. In the Number of Events field, you can select the number of events of the type selected to be displayed. Note that a smaller number should be selected in order for the events to fit comfortably in the map.
26. In the Label field, specify if the event title or the event code will be used as a label in the treemap.
27. In the Size field, select the indicator that will determine the size of each box representing events.
28. In the Color Scheme field, select the indicator that will determine the colors of each box representing events. The scale will vary from red to green according to the indicator selected.
29. Once these options have been configured, click Apply to refresh the treemap.
30. Click Save to save the query. If you do not want to save the query, click Cancel. To return to the previous step, click Back.
Note: When the query is run at a later date, its results will be displayed according to the display mode (table, map, or treemap) selected here. Any changes made through the Configure Columns option will also be kept. However, the number of results displayed must be configured each time the query is run, as the system will revert to the default number of results (1,000 for tables and maps and 20 for treemaps). In addition, for results displayed on maps, the zoom level and position selected are also saved. By default, the zoom level will be set so as to include all objects in the scope, displaying them at the closest possible range.
When Save is clicked, the system displays a window where a name and description for the query can be entered (see figure below).
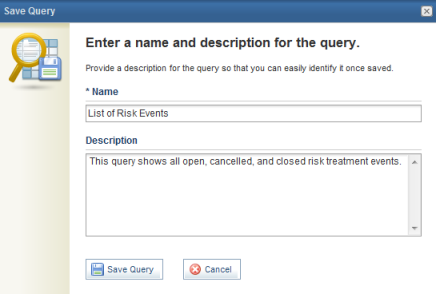
31. In the Name field, enter a name to identify the purpose and reach of the query. This field is required and accepts a maximum of 50 characters.
32. In the Description field, enter the main characteristics of the query. This field accepts a maximum of 1,000 characters.
33. When finished, click Save Query. If you want to quit the operation, click Cancel.
The system displays a success message.