1. To create a map chart, select a table with georeferenced objects and enable the Latitude and Longitude fields.
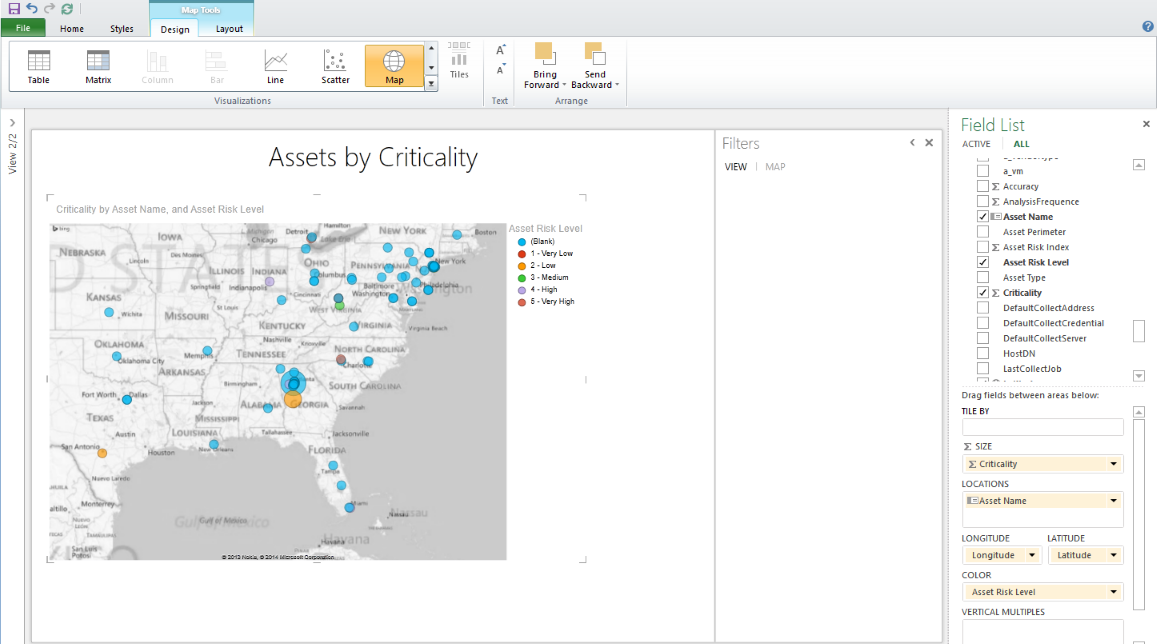
2. On the ribbon, select the Map option from the Visualizations section in the Design tab.
3. A map replaces the table as the visualization.
4. In Size field, select the field from the table used to represent the size of the bubbles displayed on the map.
5. In the Locations field, you can add one or more fields to be used in the drill-down. In the example below, the Asset Name field was included.
6. In the Color field, you can select the field used to represent the color of each bubble displayed on the map.