Once you have authenticated in the application, you are ready to start creating your own dashboard.
The first step is to choose to create a new dashboard or select an existing dashboard to edit it. Then, you must select and download the data sources that will be used in the creation of the contents of the dashboard. You can use system queries or SQL queries for Microsoft SQL Server as data sources. Finally, you need to insert the items that will be part of the dashboard, such as your charts and tables.
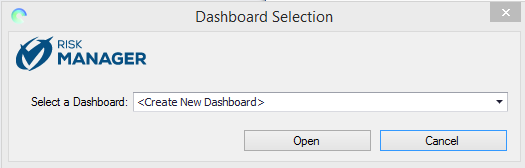
1. Access Dashboard Designer.
2. In the window that appears when you log in to the application, select the Create New Dashboard option and click Open (see figure below).
The program opens a window where you can select the data sources of the dashboard (see figure below). All data sources to which you have permission are displayed.
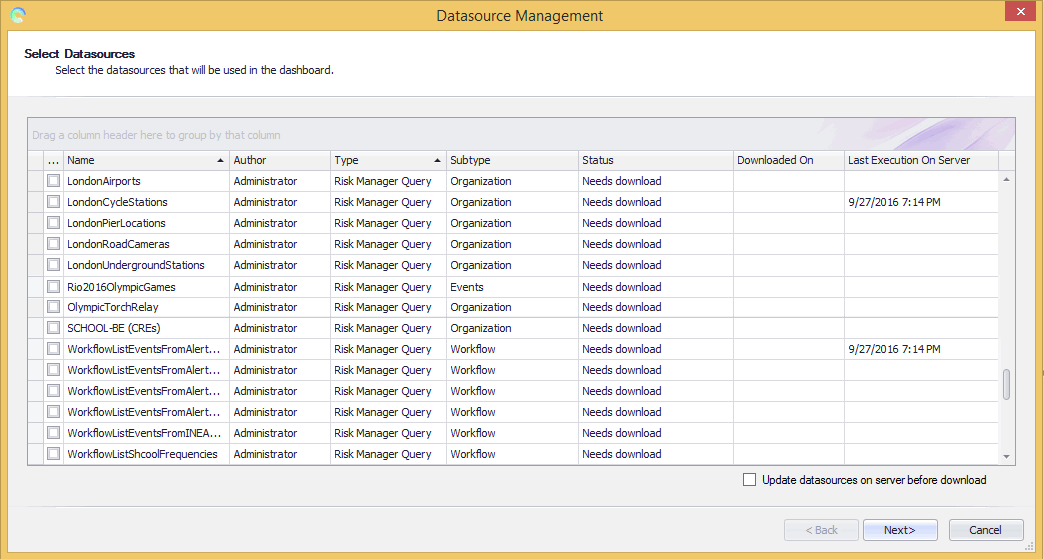
Columns display details for the data sources. For a system query, the Subtype column indicates the module or solution in which it was registered. The Status column indicates whether the data source has already been downloaded to your computer and whether the data source structure has changed, stating whether it needs to be downloaded in order to display the most recent structure. Structural changes include adding or removing a new field or column, changing the name of the data source, and changing the field type. Other changes that do not affect the data source structure, such as a field with a new value, do not require the data source to be downloaded again.
3. Mark the checkboxes next to the data sources you want to use in the dashboard.
4. Mark the Update data sources on server before download checkbox if you want to update the data sources that have already been downloaded to your local database and that may be outdated.
5. Click Next to go to the step where you can download the selected data sources. If you want to quit the operation, click Cancel.
The program displays the Download Datasources step, where data sources can be downloaded (see figure below).
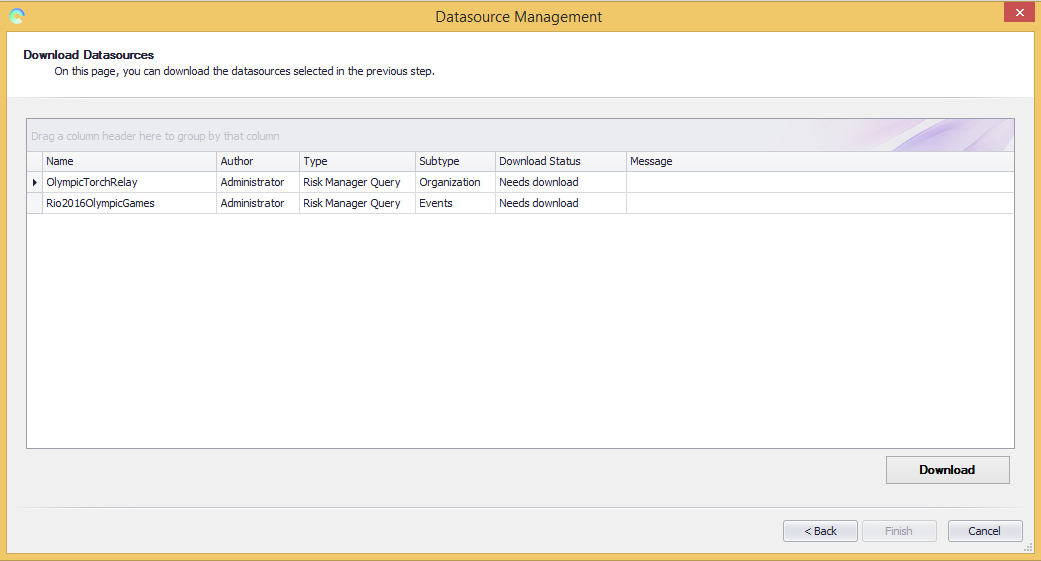
6. Click Download to download the selected data sources. This option is only displayed if at least one of the selected data sources is not downloaded to your local database.
Note: Downloading a data source and updating it are different operations. When you download data sources, only the data sources that are not in your local database will be downloaded, and there may be differences between the data sources stored in your local database and those on the server. For the most recent data to be displayed, we recommend that you select the option from the previous step to update the downloaded data sources.
The downloaded data sources will be highlighted in green. Data sources that display an error will be displayed in red with details of the error in the Message column.
7. When finished, click Finish.
The structure of the selected data
sources will be displayed on the left (see figure below), which can be expanded
by clicking the arrows ( ) next to each font. The editing area
will be empty until one of the content options is included in the dashboard.
) next to each font. The editing area
will be empty until one of the content options is included in the dashboard.
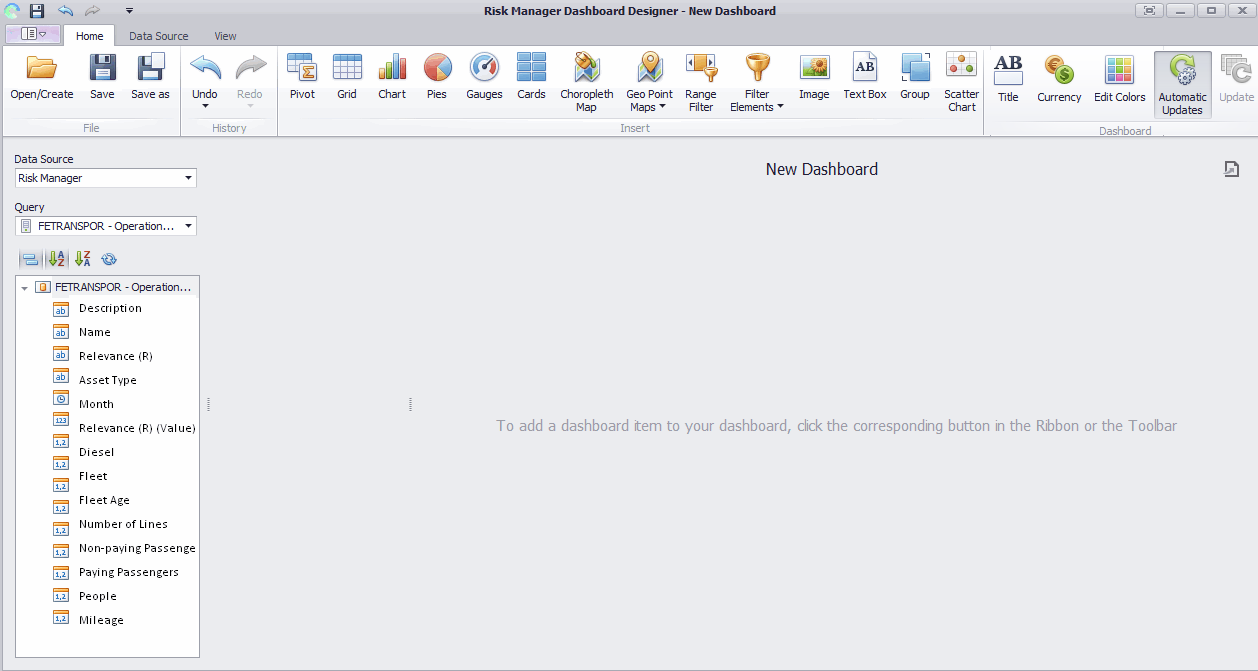
The Data Source field displays the data source provider, while the Query field displays the data source selected.
8. To view another data source, in the Query field select the data source you want to view.
9. On the Home tab, in the Insert section, select a data visualization item.
If you selected the Chart option, the Values, Arguments, and Series fields will be displayed in the Data Items section. Note that the fields change depending on the item you selected.
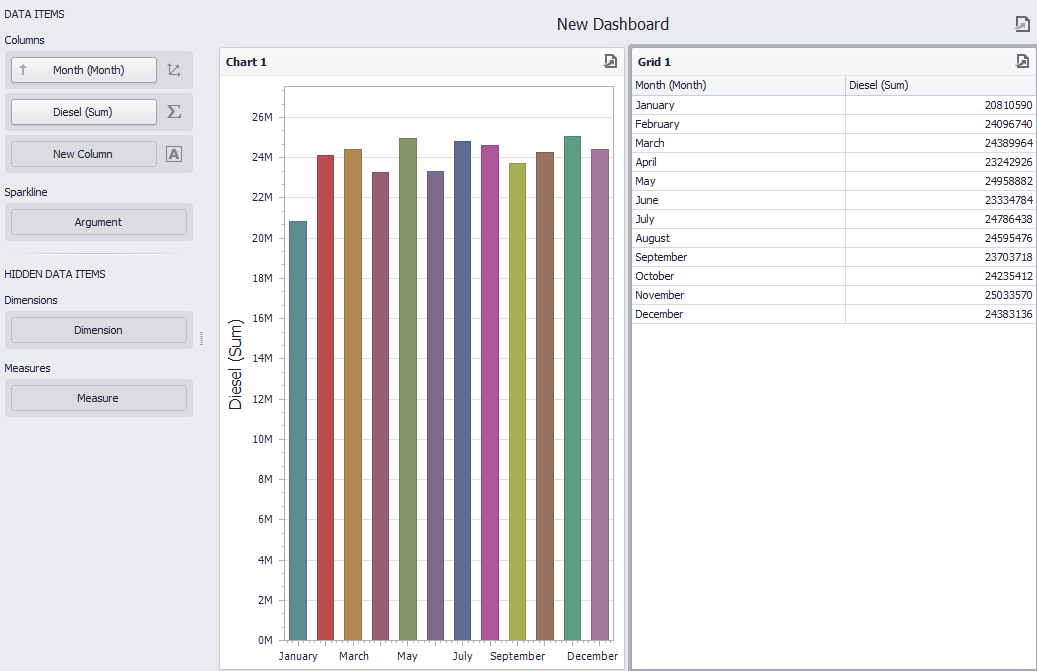
10. Drag and drop a field from the data source to a chart data item (see figure below).
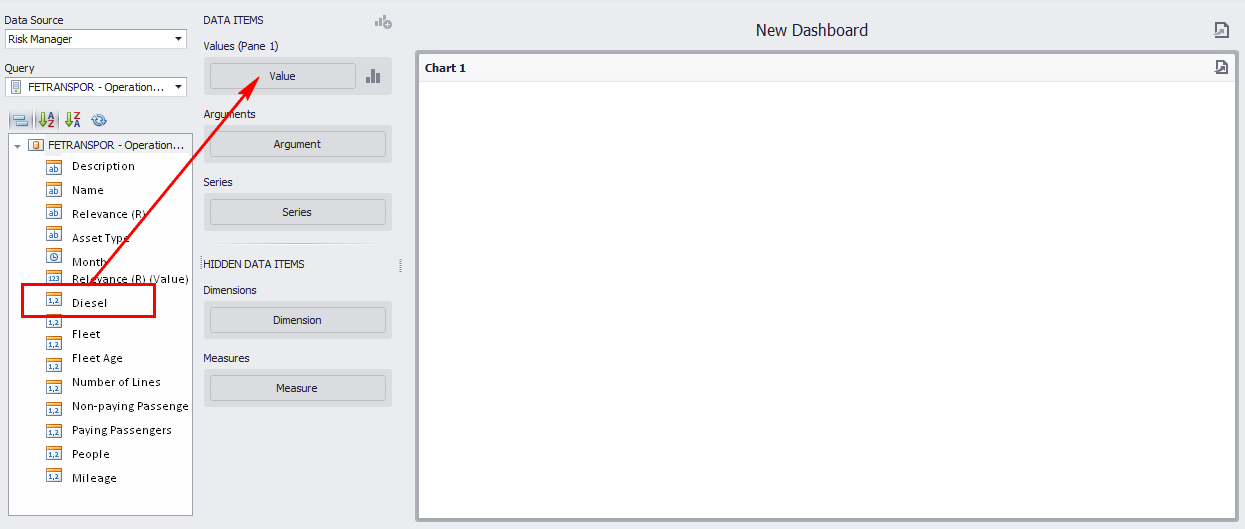
In the figure above, the Diesel field was dragged to the Value field, displaying the field values on the Y axis of the chart.
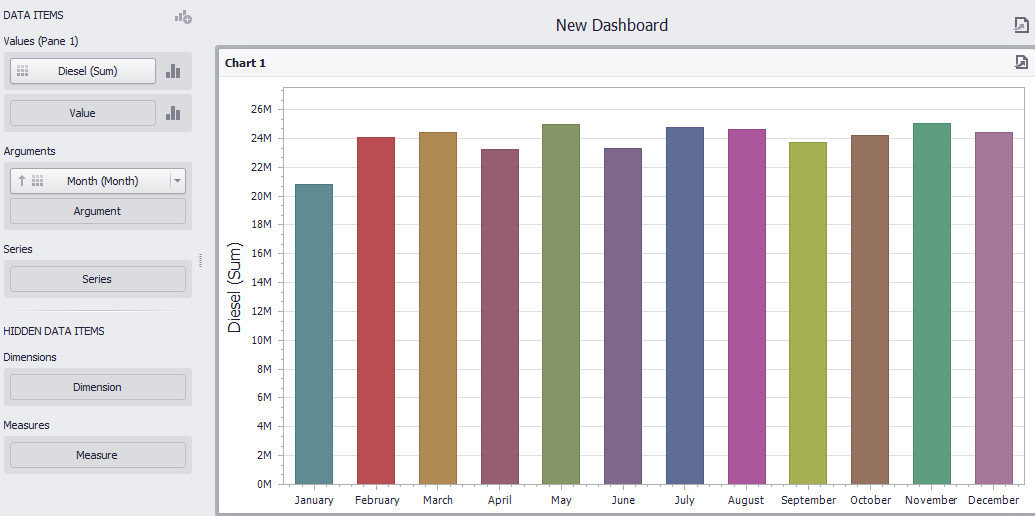
11. Repeat the operation by dragging and dropping the desired field of the data source to the Argument field to display its contents on the X axis.
12. If you want to create a series chart, drag the desired field of the data source to the Series field.
The chart is displayed with the selected specifications (see figure below). The chart shows the monthly diesel consumption, in liters, of a bus fleet.
The program allows you to customize captions, chart colors, and series types; order fields; rotate axes; drill-down; and more.
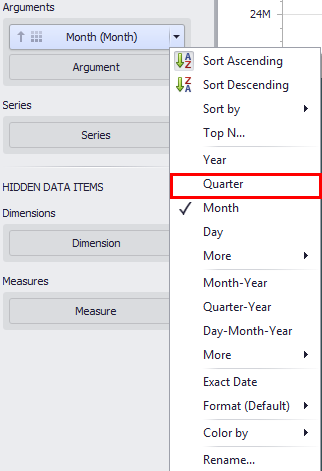
13. To display
the data by quarter instead of month, in Arguments, position the mouse
over the field, click the arrow () to see the list of options, and
select Quarter (see figure below).
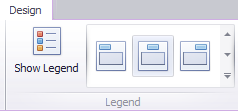
14. To display the series caption at the top of the chart, on the Design tab of the main menu, click Show Legend (see figure below).
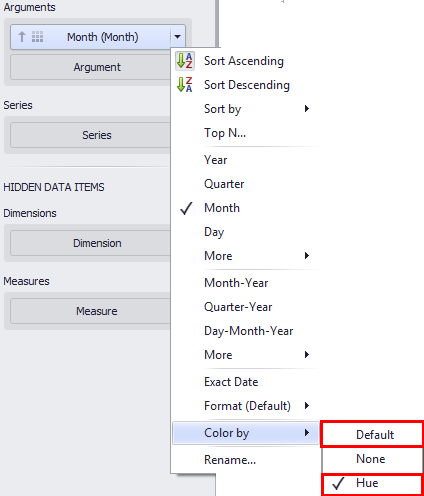
15. To display
colors on the chart, under Arguments, position the cursor over the field,
click the arrow () to see the list of options, select
Color by and then Default or Hue (see figure below). Note
that the color scheme that will be applied must be previously defined in the
Coloring section of the Design tab.
You can include other data visualization items in the dashboard, using different fields to supplement the data of another item, or even using the same fields to provide a different interpretation of the data.
16. To copy the chart, in the Item section of the Home tab, click Duplicate.
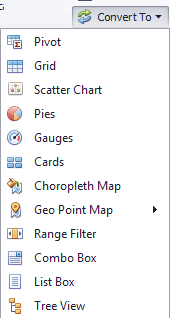
17. To convert the chart to another item, click Convert To and select the desired item (see figure below).
The program displays the selected item. In the example below, the same data used in the chart is displayed in the grid (see figure below).
18. When finished configuring the contents of the dashboard, on the Home tab, click Save to save the changes.
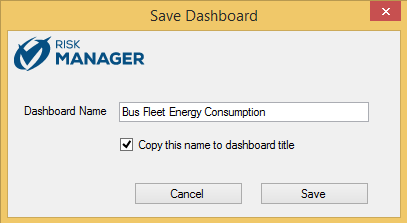
19. In the window that appears, provide a unique name for the dashboard in the Dashboard Name field, using a maximum of 99 characters.
20. Mark the Copy this name to the dashboard title checkbox if you want to use the dashboard name as its title. Keep in mind that the name identifies the dashboard in Modulo Risk Manager lists, while its title is displayed at the top of the dashboard when you open it.
21. Click Save to confirm. If you want to quit the operation, click Cancel (see figure below).
The dashboard is saved and displayed in the Data Analytics module.