This topic explains how to create consolidated queries to indicators through the Risk module. Indicators are consolidated in query results using data from one or more projects included in the scope of the query. The information displayed considers the latest closed questionnaires related to the assets analyzed in the projects. This means that if the same asset component is analyzed in more than one project, its analysis results will display only the risk indicators obtained from the latest closed questionnaire. Information from other projects will not be included in these results.
1. Access the Risk module.
2. Select List Queries from the Queries section.
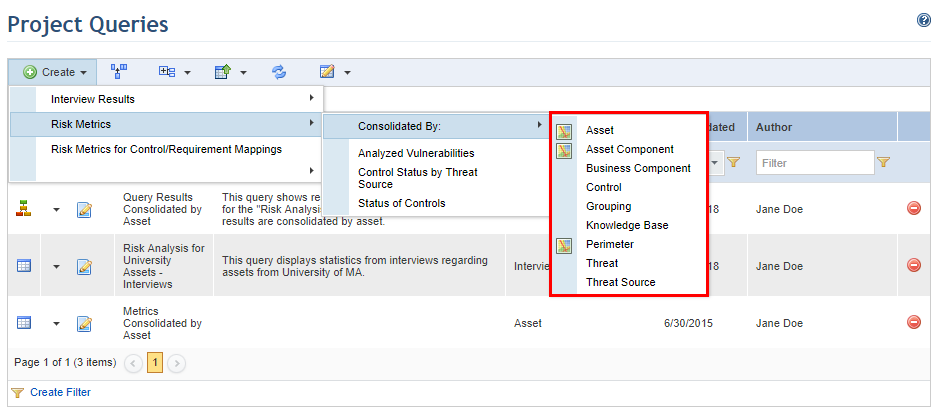
3. In the Project Queries section, click Create.
4. Under Risk Metrics, select Consolidated By:
The system displays a list of the objects for which indicators can be consolidated (see figure below). Those whose results can be viewed through both tables and maps are indicated by the map icon to the left. However, this list does not indicate which queries can have their results displayed through the integrated overview, and the icon for this is shown only in the list of queries. Keep in mind that the integrated overview can only be generated through queries consolidated by asset, and only if it was the selected display mode when the query was last saved.
5. Select from the drop-down list the object by which you want to consolidate the query results.
Note: The objects by which query results can be consolidated are:
•Asset: this option displays consolidated risk indicators for all assets related to the projects selected in the scope of the query.
•Asset Component: this option displays consolidated risk indicators for all asset components related to the projects selected in the scope of the query.
•Business Component: this option displays consolidated risk indicators for all business components related to the projects selected in the scope of the query.
•Control: this option displays consolidated risk indicators for all controls related to the projects selected in the scope of the query.
•Grouping: this option displays consolidated risk indicators for all control groupings related to the projects selected in the scope of the query.
•Knowledge Base: this option displays consolidated risk indicators for all knowledge bases related to the projects selected in the scope of the query.
•Perimeter: this option displays consolidated risk indicators for all perimeters related to the projects selected in the scope of the query.
•Threat: this option displays consolidated risk indicators for all threats related to the projects selected in the scope of the query.
•Threat Source: this option displays consolidated risk indicators for all threat sources related to the projects selected in the scope of the query.
The system displays the Scope step in the wizard for creating queries, where the risk management projects from which risk indicators will be obtained for consolidation can be selected (see figure below).
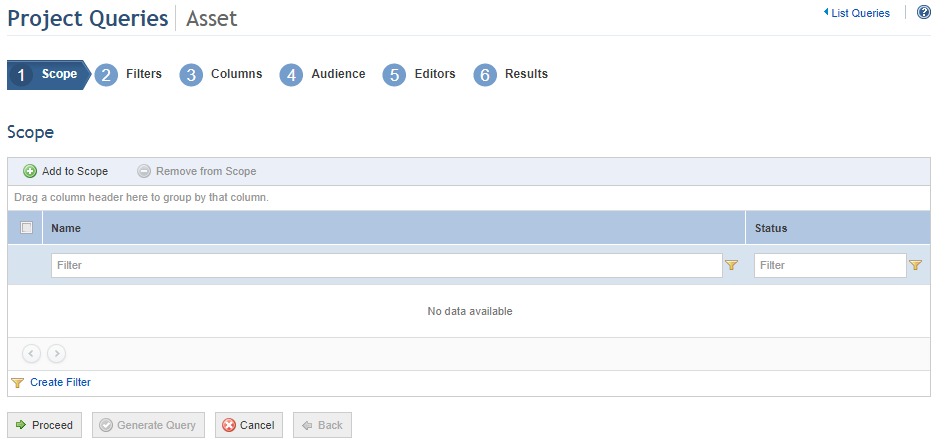
6. Click Add to Scope to select the projects to be included in the scope.
The system displays a list containing all the open or closed risk management projects registered in the system (see figure below). Cancelled projects will not be listed.
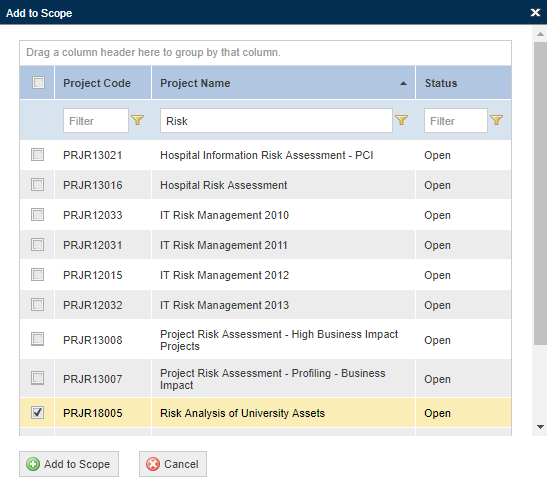
7. Select the projects you want to include in the scope by marking the checkboxes next to each and clicking Add to Scope. If you want to quit the operation, click Cancel.
8. To remove a project from the scope, mark the checkbox next to it and click Remove from Scope.
9. When finished, click Proceed to continue creating the query. If you want to run the query, click Generate Query. If you want to quit the operation, click Cancel.
When Proceed is clicked, the system displays the Filters step in the wizard for creating the query, where the filters to be used can be selected, which will reduce the information used to consolidate the results (see figure below).
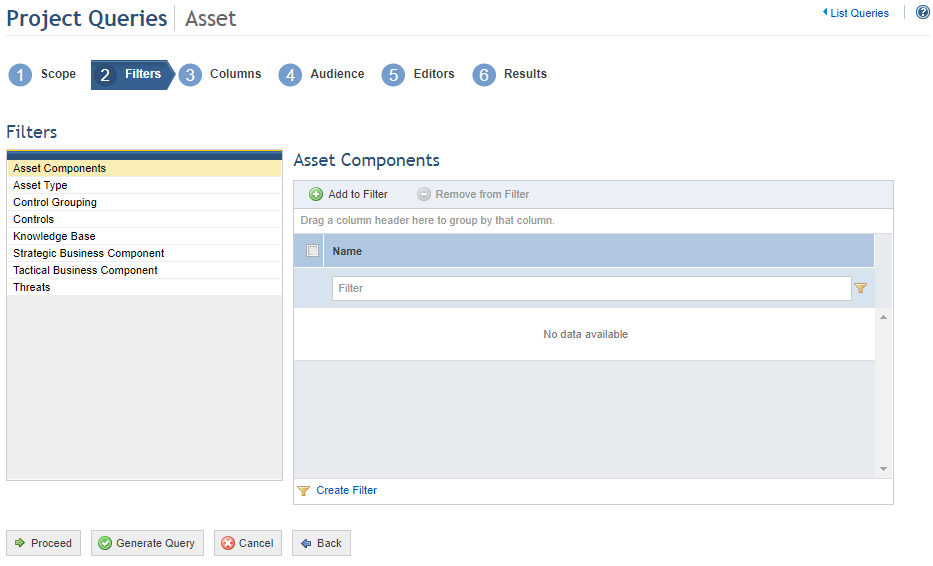
Note: Risk metrics are always consolidated based on the controls, since this is the most granular object that can be analyzed in a project. Selecting a filter means specifying the controls whose indicators you want to view in the consolidated results. If, for example, you choose to filter the query by asset component, only controls from the knowledge bases associated with the asset components selected in the filter will be used to generate the query results.
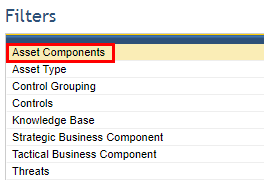
All consolidated queries can be filtered by strategic business components, tactical business components, knowledge bases, controls, asset components, threats, control groupings, and asset types.
10. Select the filter you want to use by clicking one of the filter options displayed on the left (see figure below).
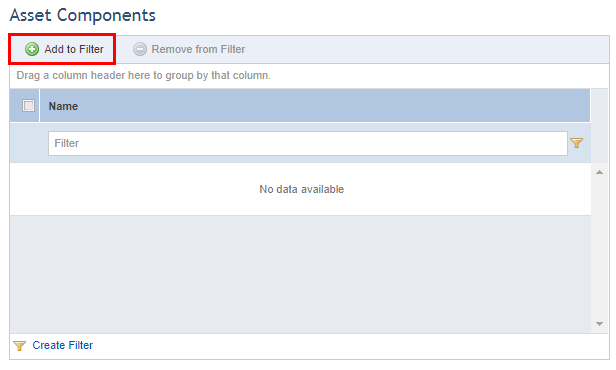
11. Click Add to Filter to select the objects that will be used to filter the scope of the query (see figure below).
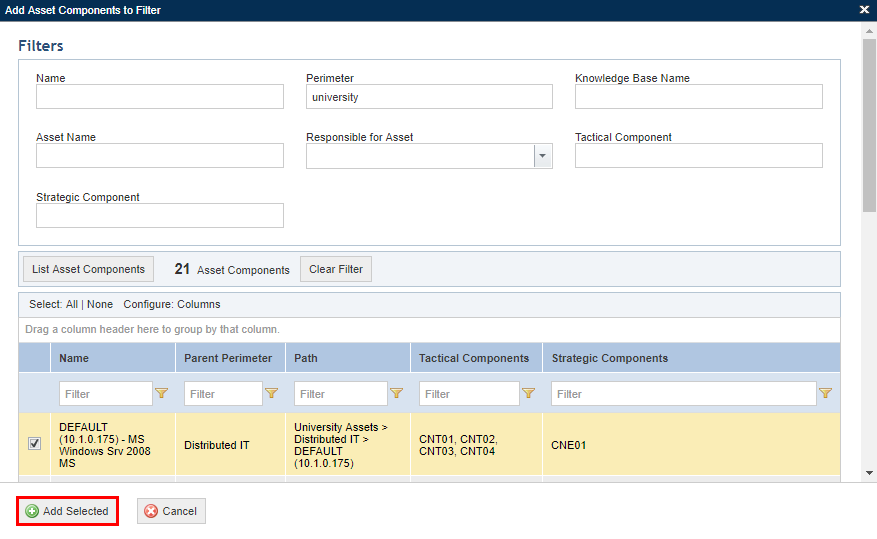
12. Select the objects to be added to the filter in the window that appears and click Add Selected (see figure below). If you want to quit the operation, click Cancel.
The system displays the objects selected for the filter.
13. To remove objects from the filter, mark the checkbox next to each object and click Remove from Filter.
14. After selecting the filters, click Proceed to continue creating the query. If you want to generate the query, click Generate Query. If you want to cancel query creation, click Cancel. To return to the previous step at any point during this wizard, click Back.
When Proceed is clicked, the system displays the Columns step in the wizard for creating the query, where the columns to be displayed in the query results can be selected (see figure below).
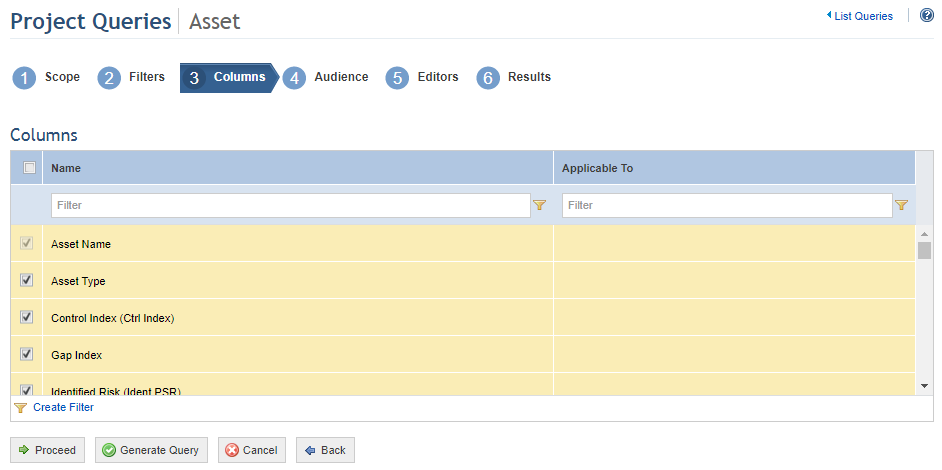
15. Select the columns you want to include in the query by marking the checkboxes next to each option. By default, the system will show some pre-selected options that can be removed, while others are required columns. To include or remove optional columns in the results, simply mark or unmark the checkboxes next to their names.
16. Click Proceed to continue creating the query. If you want to generate the query, click Generate Query. If you want to cancel query creation, click Cancel. To return to the previous step at any point during this wizard, click Back.
When Proceed is clicked, the system displays the Audience step, where you can select which people and groups will be able to view the query in the Home module and in this module, if they have permission to access it (see figure below).
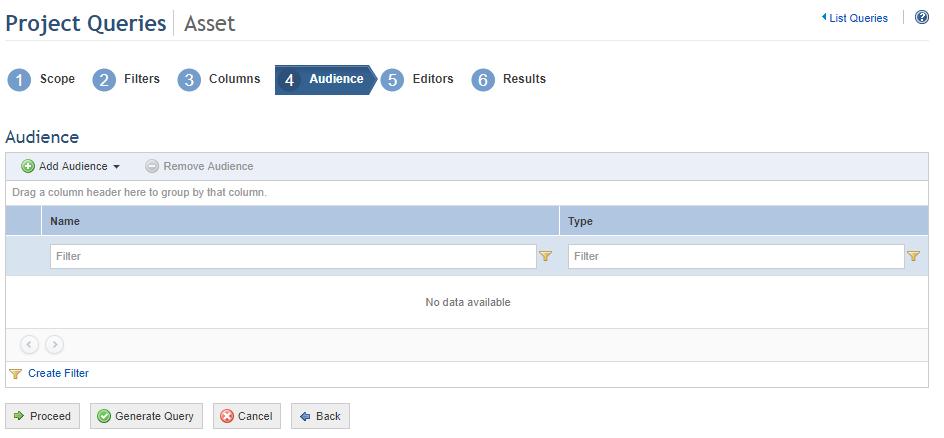
17. Click Add Audience and select People or Groups to add them.
18. If, for example, you selected People, select the people to be added and click Add People (see figure below). If you want to quit the operation, click Cancel.
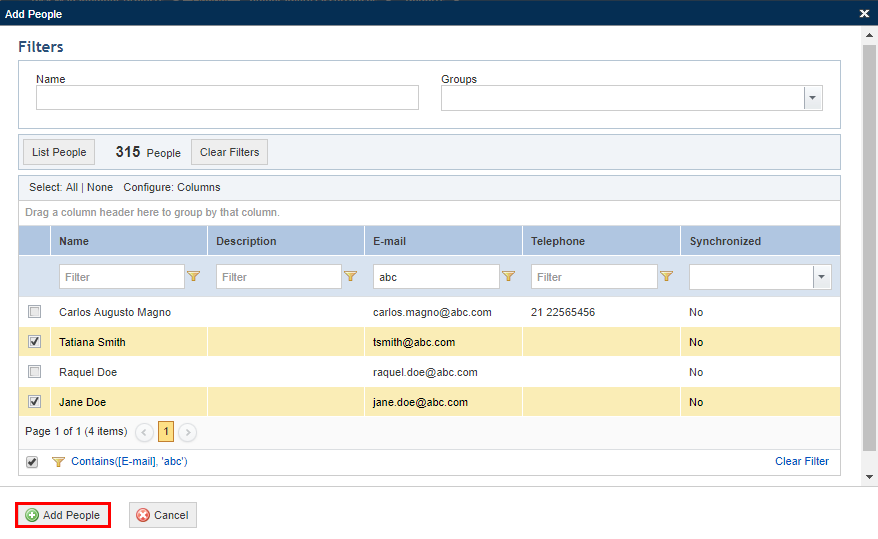
The system displays the people selected.
19. To remove people or groups from the audience, mark the checkboxes next to their names and click Remove Audience.
The system requests confirmation to remove the people or groups from the audience (see figure below).
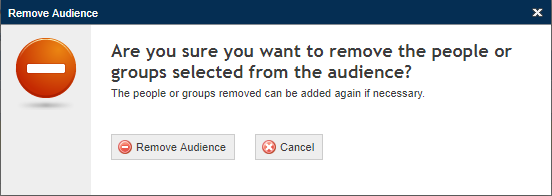
20. Click Remove Audience to confirm. If you want to quit the operation, click Cancel.
The system removes the people selected from the audience.
21. Click Proceed to continue creating the query. If you want to generate the query, click Generate Query. If you want to cancel query creation, click Cancel. To return to the previous step, click Back.
When Proceed is clicked, the system displays the Editors step, where you can select which people and groups will be able to edit the query, receiving the same permissions to it as the author (see figure below).
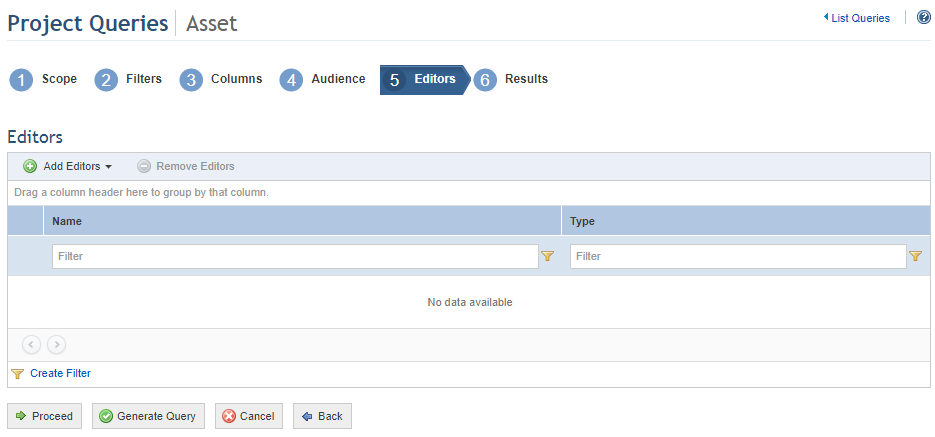
22. Click Add Editors and select People or Groups to add them to the list of editors.
23. If, for example, you selected People, select the people to be added and click Add People (see figure below).
The system displays the people selected.
24. To remove people or groups from the list of editors, mark the checkboxes next to their names and click Remove Editors.
The system requests confirmation to remove the people or groups from the list of editors (see figure below).
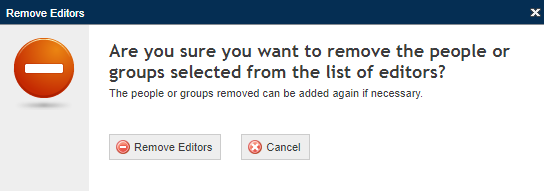
25. Click Remove Editors to confirm. If you want to quit the operation, click Cancel.
The system removes the people selected from the list of editors.
26. Click Proceed or Generate Query to run the query. If you want to cancel query creation, click Cancel. To return to the previous step, click Back.
When Proceed or Generate Query is clicked, the system displays the query results (see figure below).
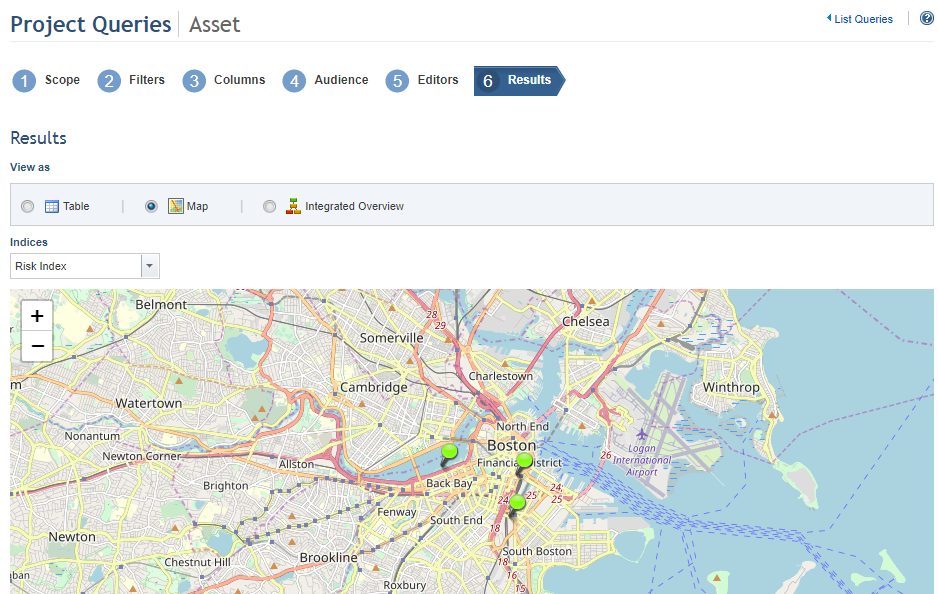
Note: The results of queries consolidated by perimeter, asset, and asset component can be displayed on a map. However, for there to be results to display, at least one of the objects in the scope of the query must have had a location specified for it in the Organization module. An alert is displayed if no geographic locations were specified for the objects added to the scope. Note that the option to display maps must be enabled in the Display Options section of the Administration module. An internet connection is also required, otherwise an alert will appear and the map will not be displayed. The map provider must be preconfigured in the system configuration file (web.config). Keep in mind that some providers require a key or access code that is available only to those who purchase their license. It is the user’s responsibility to acquire it.
Remember that only the results of queries consolidated by asset can be displayed through the integrated overview.
By default, the zoom level will be set to include all objects in the scope, displaying them at the closest possible range. The pin colors representing each risk metric can also be customized in the Scales section of the Administration module.
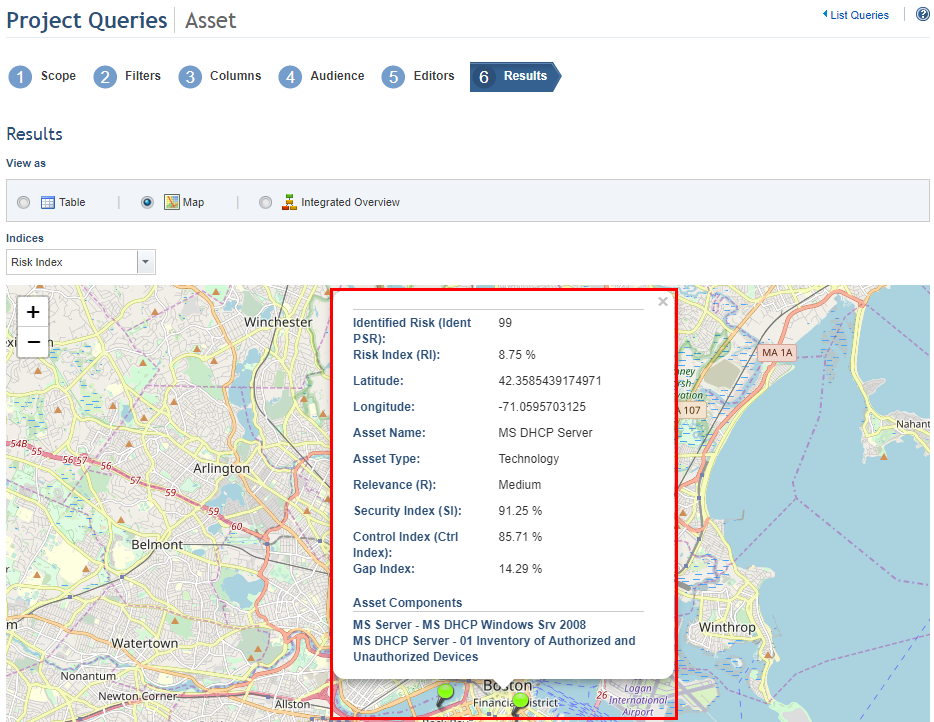
27. If the results are displayed on a map, click the pin representing the asset, asset component, or perimeter whose details you want to view, including the information contained in the columns selected when the query was created.
The system displays a bubble window containing information on the object selected (see figure below).
28.
To close the bubble, click Close ( ).
).
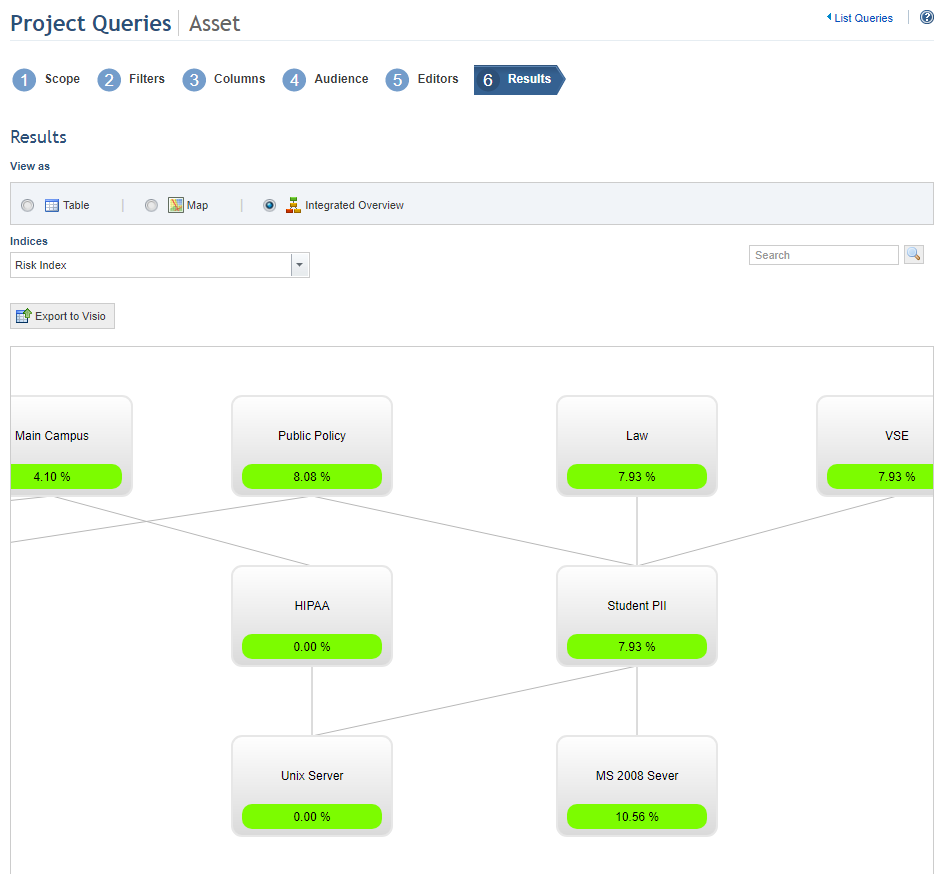
29. Click Integrated Overview to view the results of a query consolidated by asset through the integrated overview (see figure below).
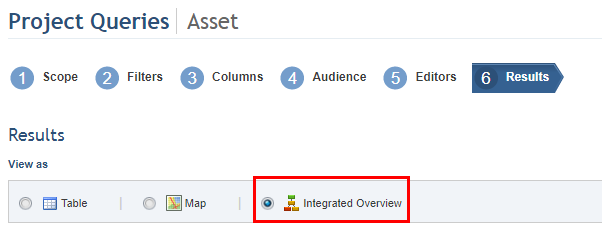
The system displays the results of the query through the integrated overview (see figure below).
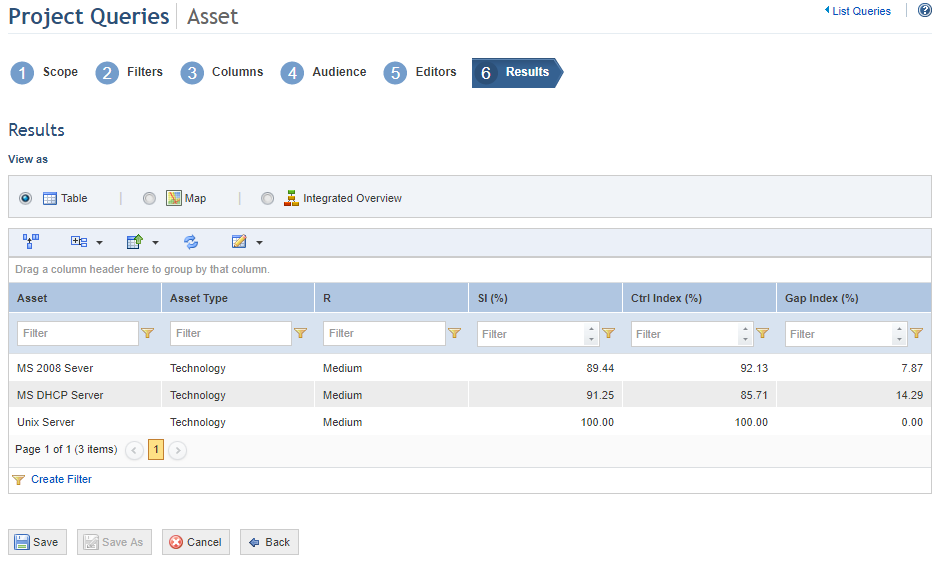
30. Click Table to view the query results on a table.
The system displays the query results through a table (see figure below).
31. Click Save to save the query data. If you do not want to save the query, click Cancel. To return to the previous step, click Back.
Note: The system will save the query results to be viewed in the future through a table or map, depending on how they were displayed when the query was saved. Thus, if the query results were displayed on a map when it was last saved, the query will load on a map when it is run. In addition, the zoom level and position of each map can be saved in this step, defining how the map will be displayed when the query is run.
When Save is clicked, the system displays a window where a name and description for the query can be entered (see figure below).
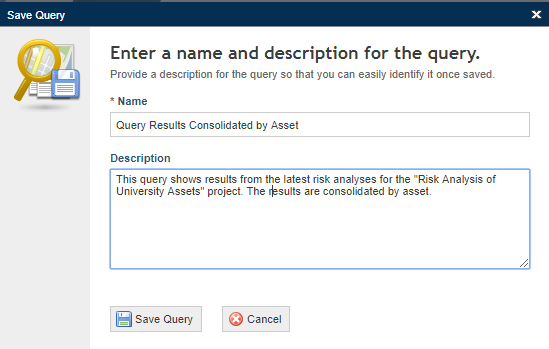
32. In the Name field, enter a name to identify the purpose and reach of the query using up to 50 characters.
33. In the Description field, enter the main characteristics of the query using up to 4,000 characters.
34. When finished, click Save Query. If you want to quit the operation, click Cancel.
The system displays a success message.