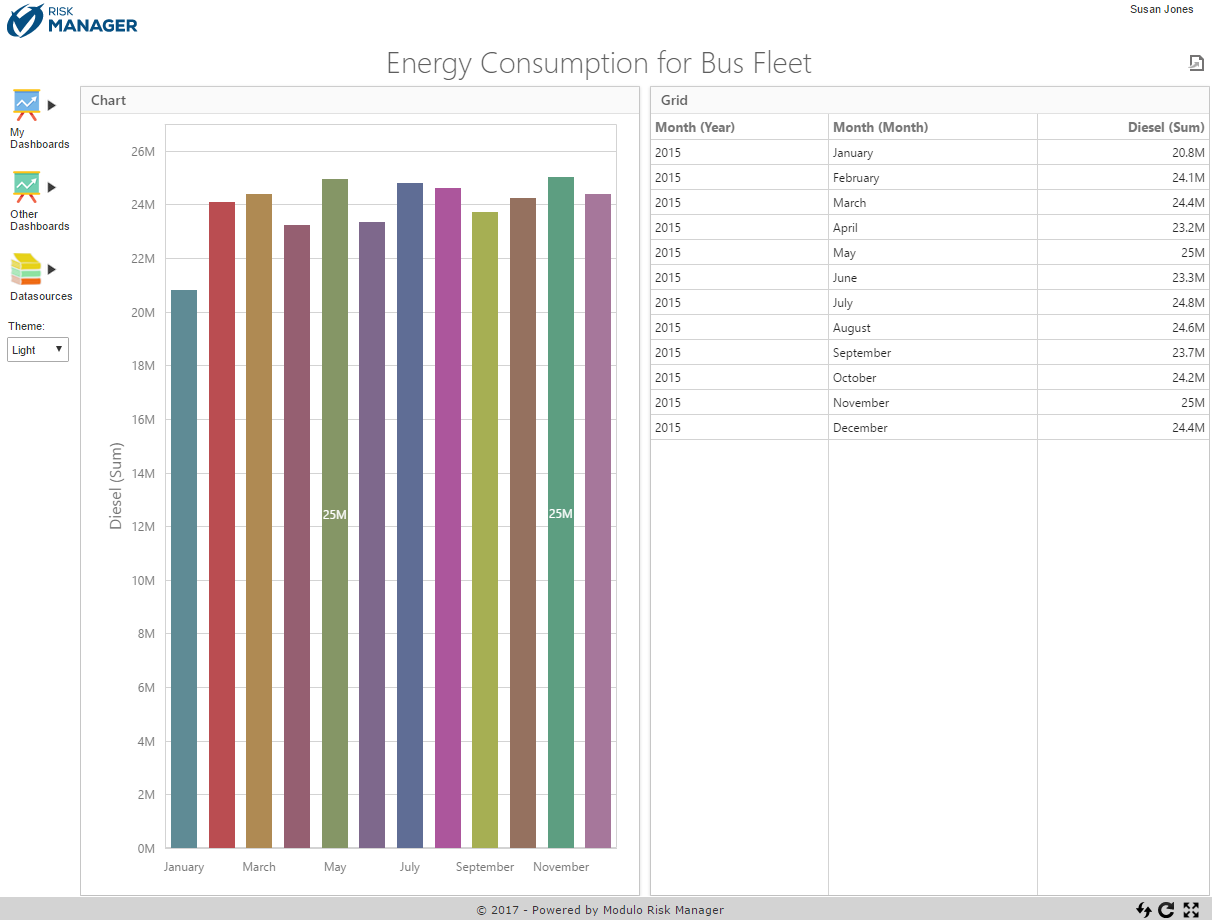
•Dashboards: Dashboards from the Data Analytics module offer support for business intelligence data analysis, allowing for better data visualization and interpretation. Dashboards are created through the Dashboard Designer editing program and can include charts, grids, pies, gauges, maps, images, filters, and other data visualization items. Data from different sources can be creatively organized in dashboards in order to suit the various needs of your organization. Authors, editors and people and groups of people included in the audience of a dashboard may view it in the Data Analytics section of the Home module or, if they have permission, view it directly in the Data Analytics module.

•Excel files: Tables from Excel files can be used as data sources in dashboards. You can select which tables you want to import and include people and groups of people in the audience of a file so that they may also use the tables as data sources in their own dashboards.