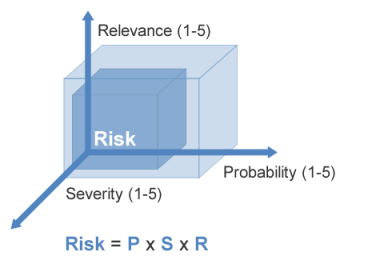
The most granular metric used to measure risk is the PSR (probability x severity x relevance). This metric takes into account the probability that the vulnerabilities encountered will be exploited, the severity of the impact they will cause if exploited, and the relevance of the organizational asset in question.
Probability: The probability (P) estimates the likelihood that an event will take place.
"P" is scored from 1 to 5:
|
Probability |
The likelihood that the risk will take place: |
|
5 - Very High |
Is almost certain (P > 95%) |
|
4 - High |
Is very likely (65% < P ≤ 95%) |
|
3 - Medium |
Is likely (35% < P ≤ 65%) |
|
2 - Low |
Is not very likely (5% < P ≤ 35%) |
|
1 - Very Low |
Is unlikely (P ≤ 5%) |
To estimate probability, one or more factors that may influence its value must be considered:
•Knowledge required to exploit the vulnerability (in general, the more knowledge, the higher the probability). For example: understanding internal flaws in the organization or in relationships with third parties.
•Technical resources required to exploit it (in general, the fewer the resources, the higher the probability).
•Time required to exploit it (in general, the less time, the higher the probability).
•Level of asset protection through other (usually existing) controls (in general, the lower the protection, the higher the probability).
•Attractiveness of the object (in general, the more attractive, the higher the probability).
•Repercussions for the agent upon detection (in general, the lower the consequences, the higher the probability).
•Weather, political, cultural, etc. circumstances (which can increase or decrease probability).
•Other environment-specific factors (which can increase or decrease probability).
Severity: The severity (S) scores the level of impact on the organization if a risk takes place. That is, if the incident occurs, the severity scores the degree to which the performance, reliability, or quality of the asset will be impaired.
"S" is scored from 1 to 5:
|
Severity |
The risk taking place will cause: |
|
5 - Very High |
Total impairment |
|
4 - High |
Very severe impairment |
|
3 - Medium |
Severe impairment |
|
2 - Low |
Less severe impairment |
|
1 - Very Low |
Almost no impairment |
To estimate severity, a combination of one or more factors presented below must be considered that may influence its value:
•Degree of impairment of the asset’s performance. For example: process, service, or equipment productivity.
•Degree of impairment of the reliability of the process results or information, as well as the systems or related environments supported by the asset. For example: inadequate modification of localized information (less severe) or of a system or environment (more severe).
•Degree of impairment of the quality of services, information, systems, or other. For example: non-utilization of a small set of information or part of a system or environment (less severe) or rejection of an entire system or environment (more severe).
Relevance: The relevance (R) scores the level of importance an asset has to an organization, taking into consideration the business components it supports.
"R" is scored from 1 to 5:
|
Relevance |
The asset’s impairment: |
|
5 - Very High |
May affect the entire organization and losses will be extremely high |
|
4 - High |
May affect one or more of the organization’s businesses and losses will be high |
|
3 - Medium |
May affect a part of the organization’s business and losses will be considerable |
|
2 - Low |
May affect a small and localized part of the organization and losses will be low |
|
1 - Very Low |
May affect a very small and localized part of the organization’s business and losses will be minimal |
After defining the P, S, and R of an asset, its associated risk can be calculated by multiplying the values of each of these three terms (see figure below).
Using the above formula, the results will always be within the range of 1 to 125 (see table below).
|
Risk Level |
Possible PSR Values |
|
Very Low |
1, 2, 3, 4, 5, 6 |
|
Low |
8, 9, 10, 12, 15, 16 |
|
Medium |
18, 20, 24, 25, 27, 30 |
|
High |
32, 36, 40, 45, 48, 50 |
|
Very High |
60, 64, 75, 80, 100, 125 |
For the purposes of calculating risk, a control from a risk questionnaire has only three possible statuses: Implemented, Not Implemented, or Not Applicable. (A control whose status is Not Answered becomes Not Applicable when the analysis is closed.) The PSR can thus be consolidated for controls as follows:
•The identified PSR for a certain object: PSR sum of the non-implemented controls for the object.
•The controlled PSR for a certain object: PSR sum of the implemented controls for the object.
•The non-applicable PSR for a certain object: PSR sum of the non-applicable controls for the object.